Temple Light in a City of Millions
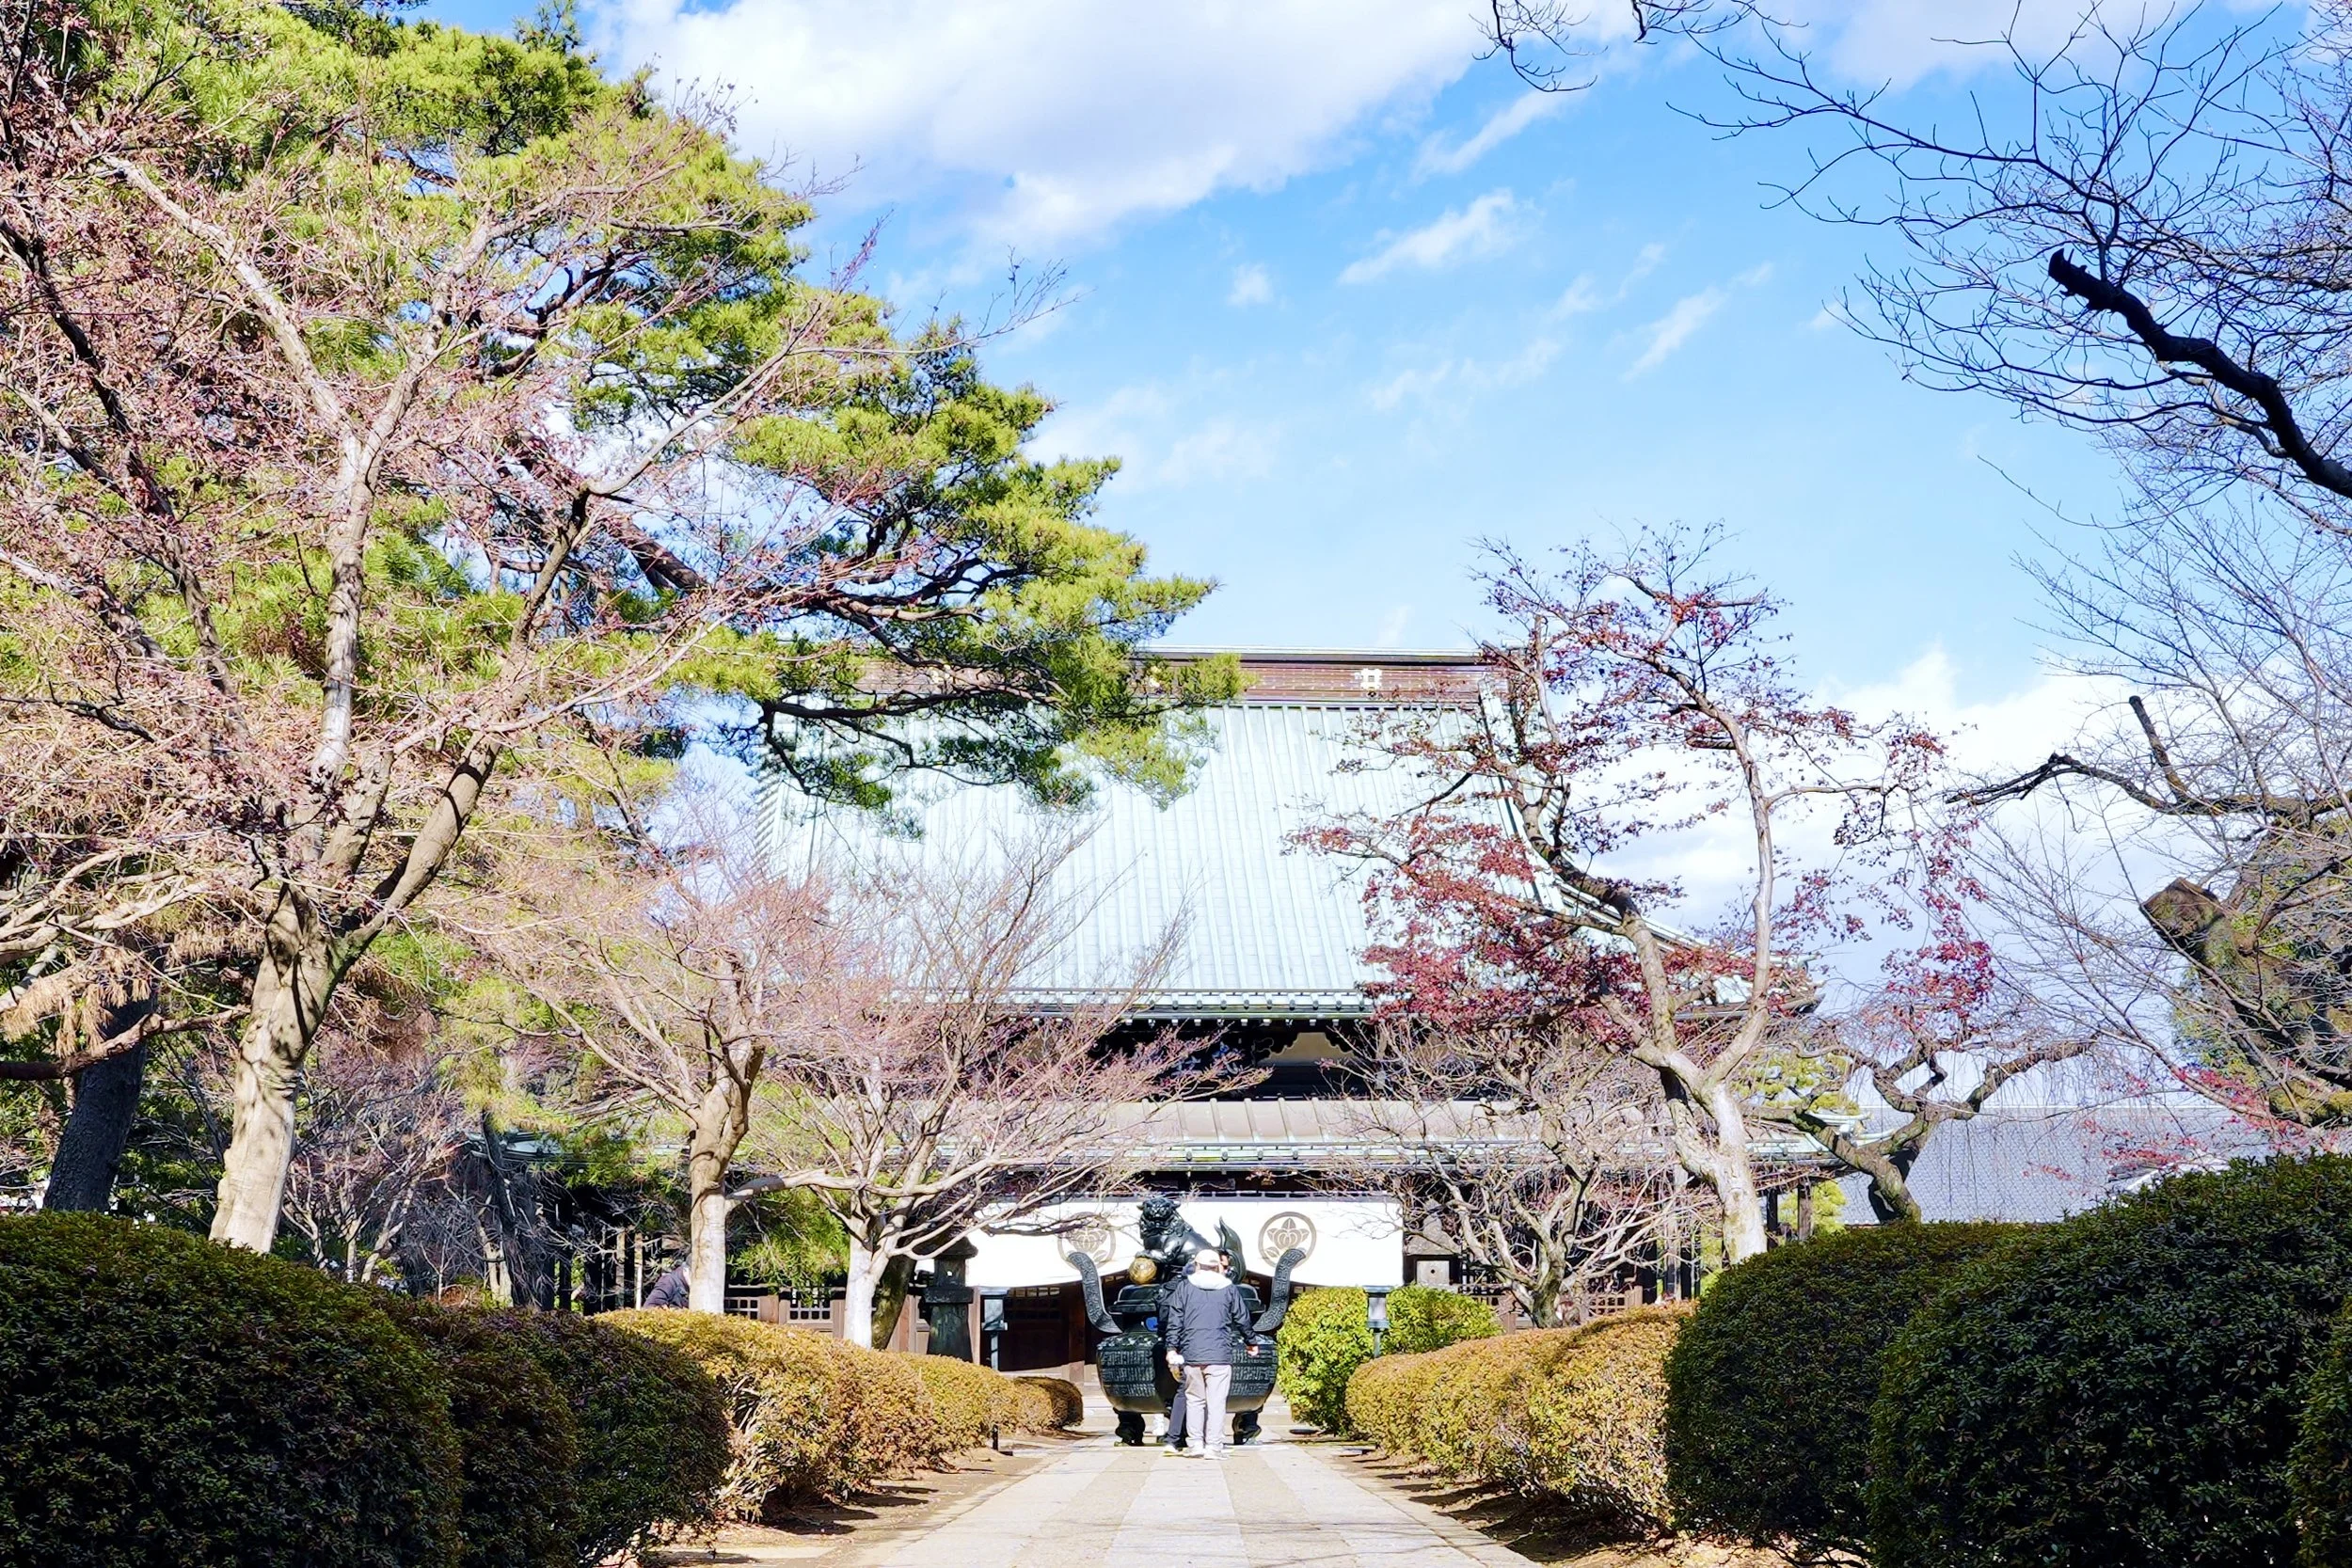
A straight, quiet path—Tokyo’s chaos reduced to a single, calm line
Tokyo is a city that invites measurement. Not because it feels cold, but because it’s so immense you naturally reach for numbers to hold it in your head. The Greater Tokyo area is often estimated at ~37 million residents, the largest metropolitan population on earth—an urban system so large it behaves like weather: flows, surges, pressure changes, calm pockets. And yet, the moment you pass into a temple garden, the whole dataset feels like it’s been filtered down to one clean row: footsteps, wind, cedar, sky.
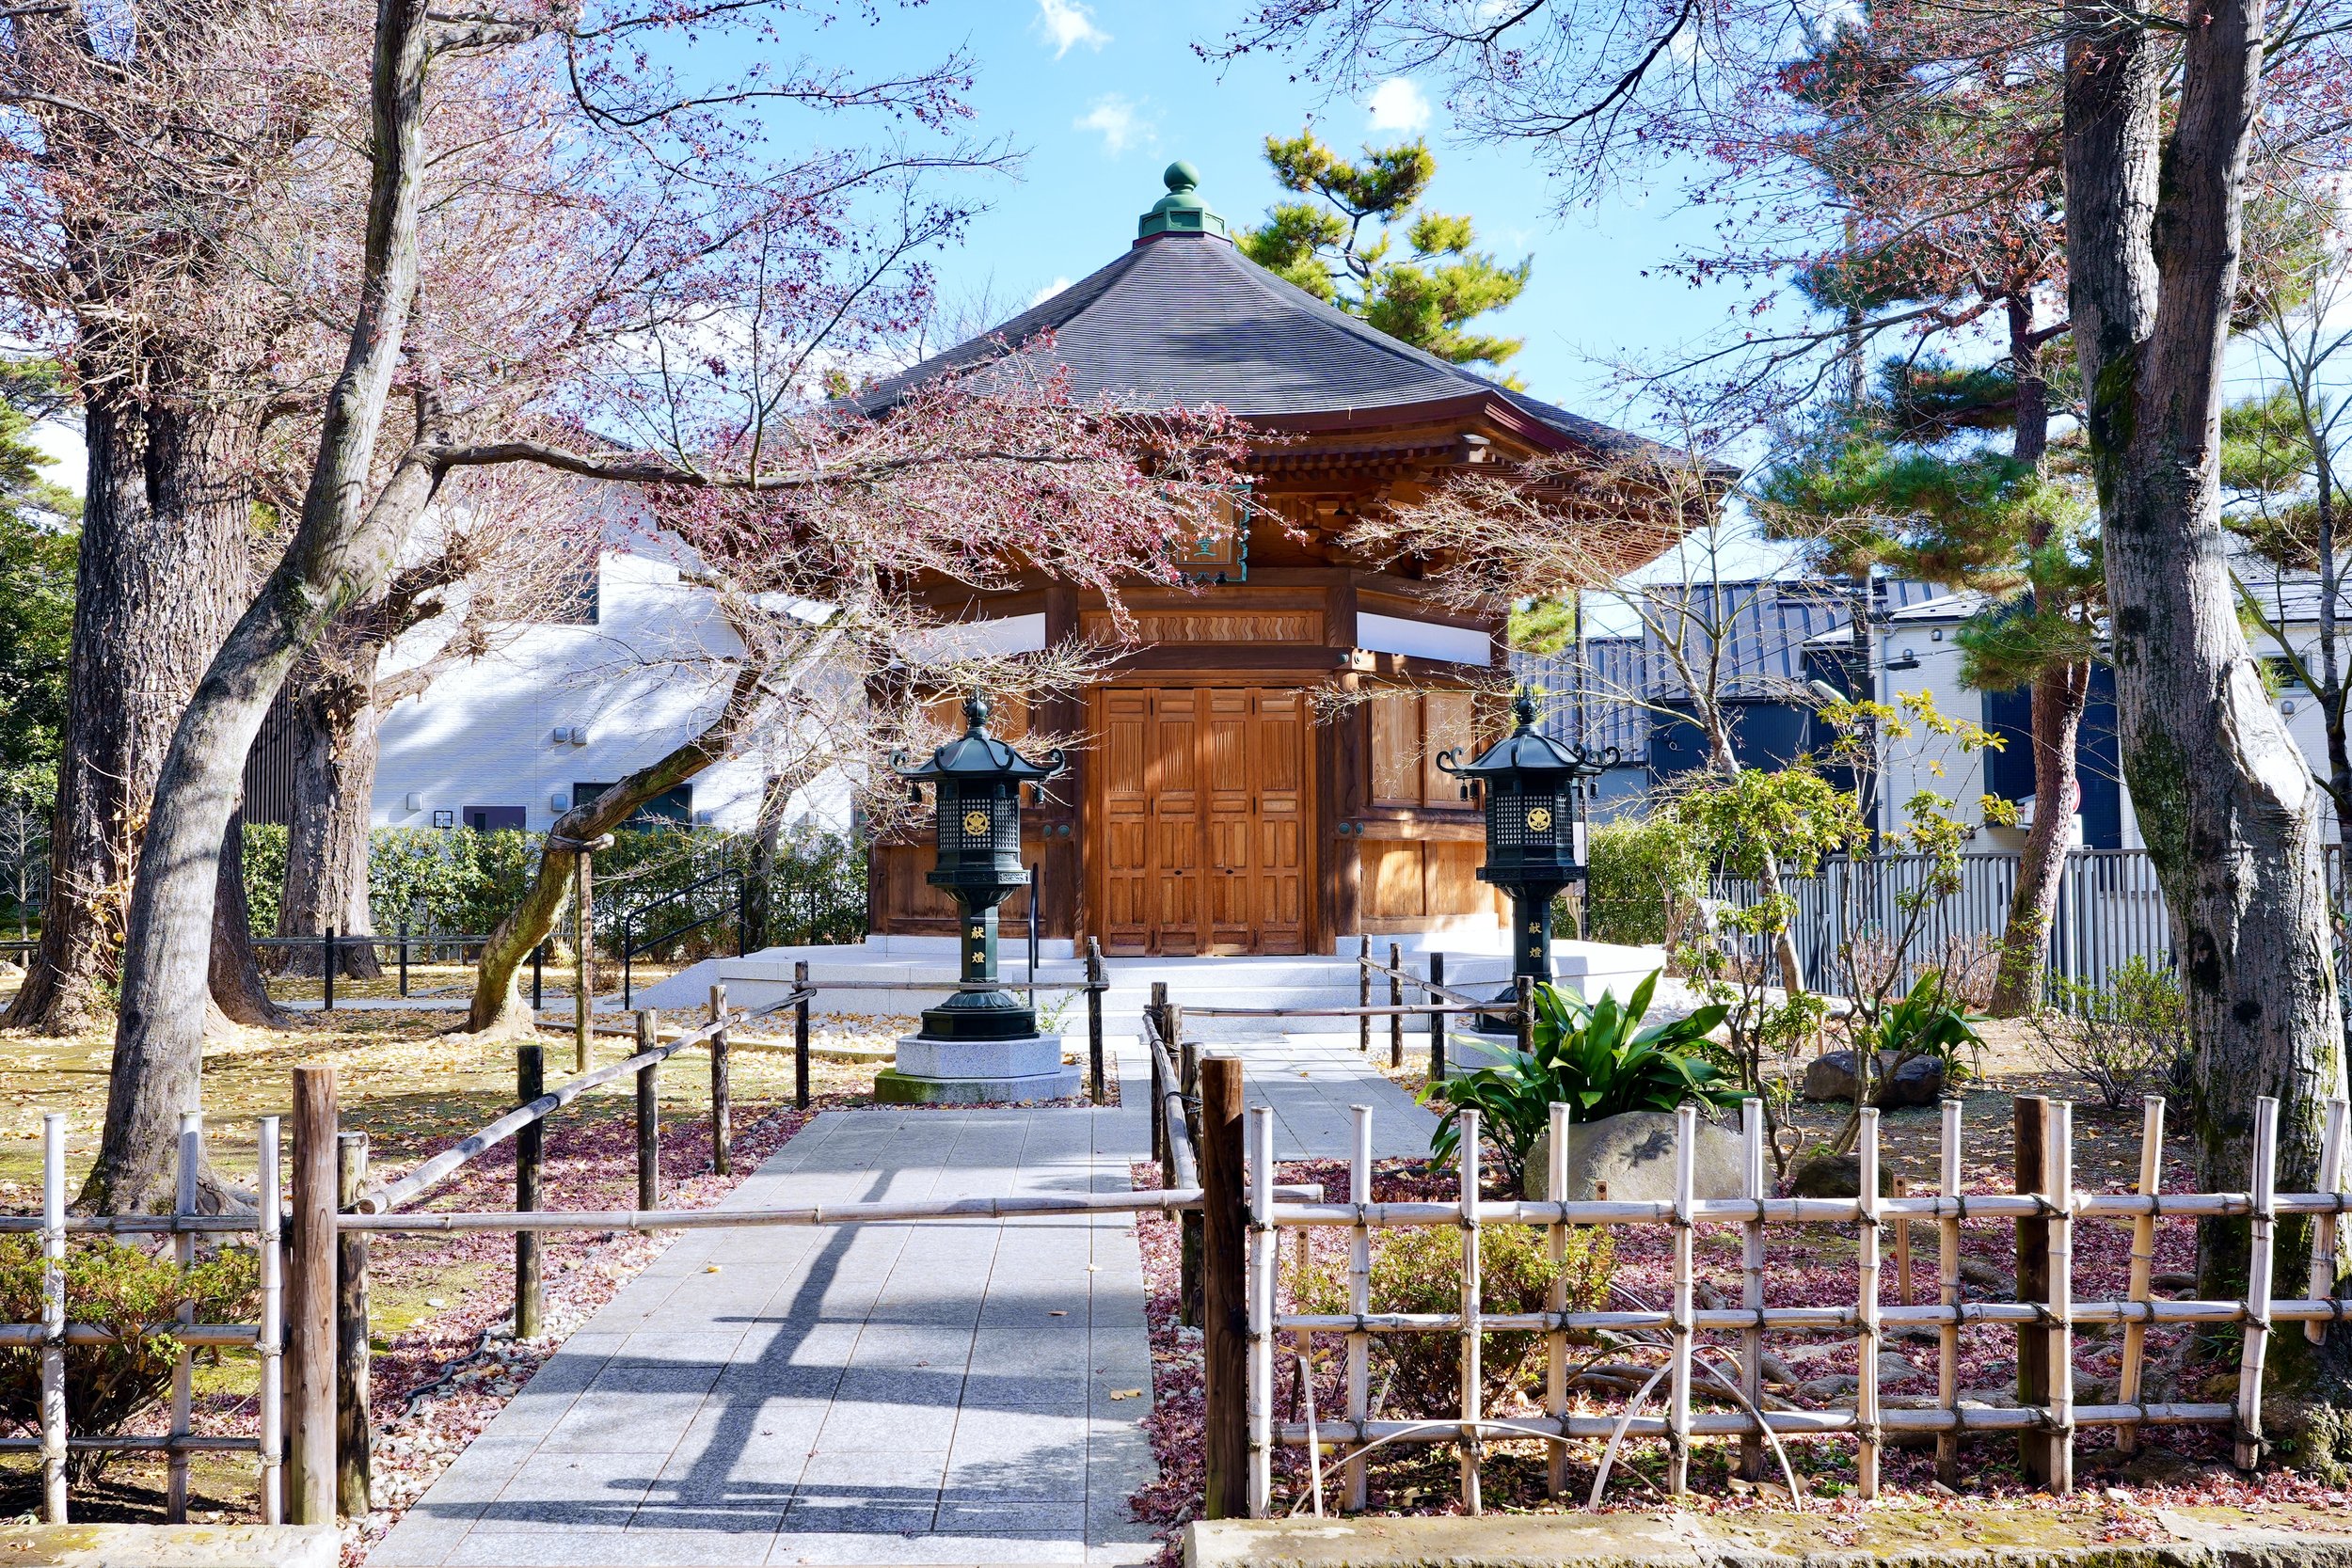
Symmetry without obsession—balanced like a good model that doesn’t overfit
As a data person, I think about scale in two directions: zoom out and you get the skyline; zoom in and you get texture. Here, the zoom-in matters. The scene isn’t trying to impress you with size. It’s trying to steady you with proportions—wood grain, stone edges, winter branches holding onto their last color.
Temples are old systems, but they’re not messy systems. Their geometry is deliberate. Their paths are readable. It reminds me of a well-designed dashboard: not loud, not busy—just the right amount of information to tell you where you are.
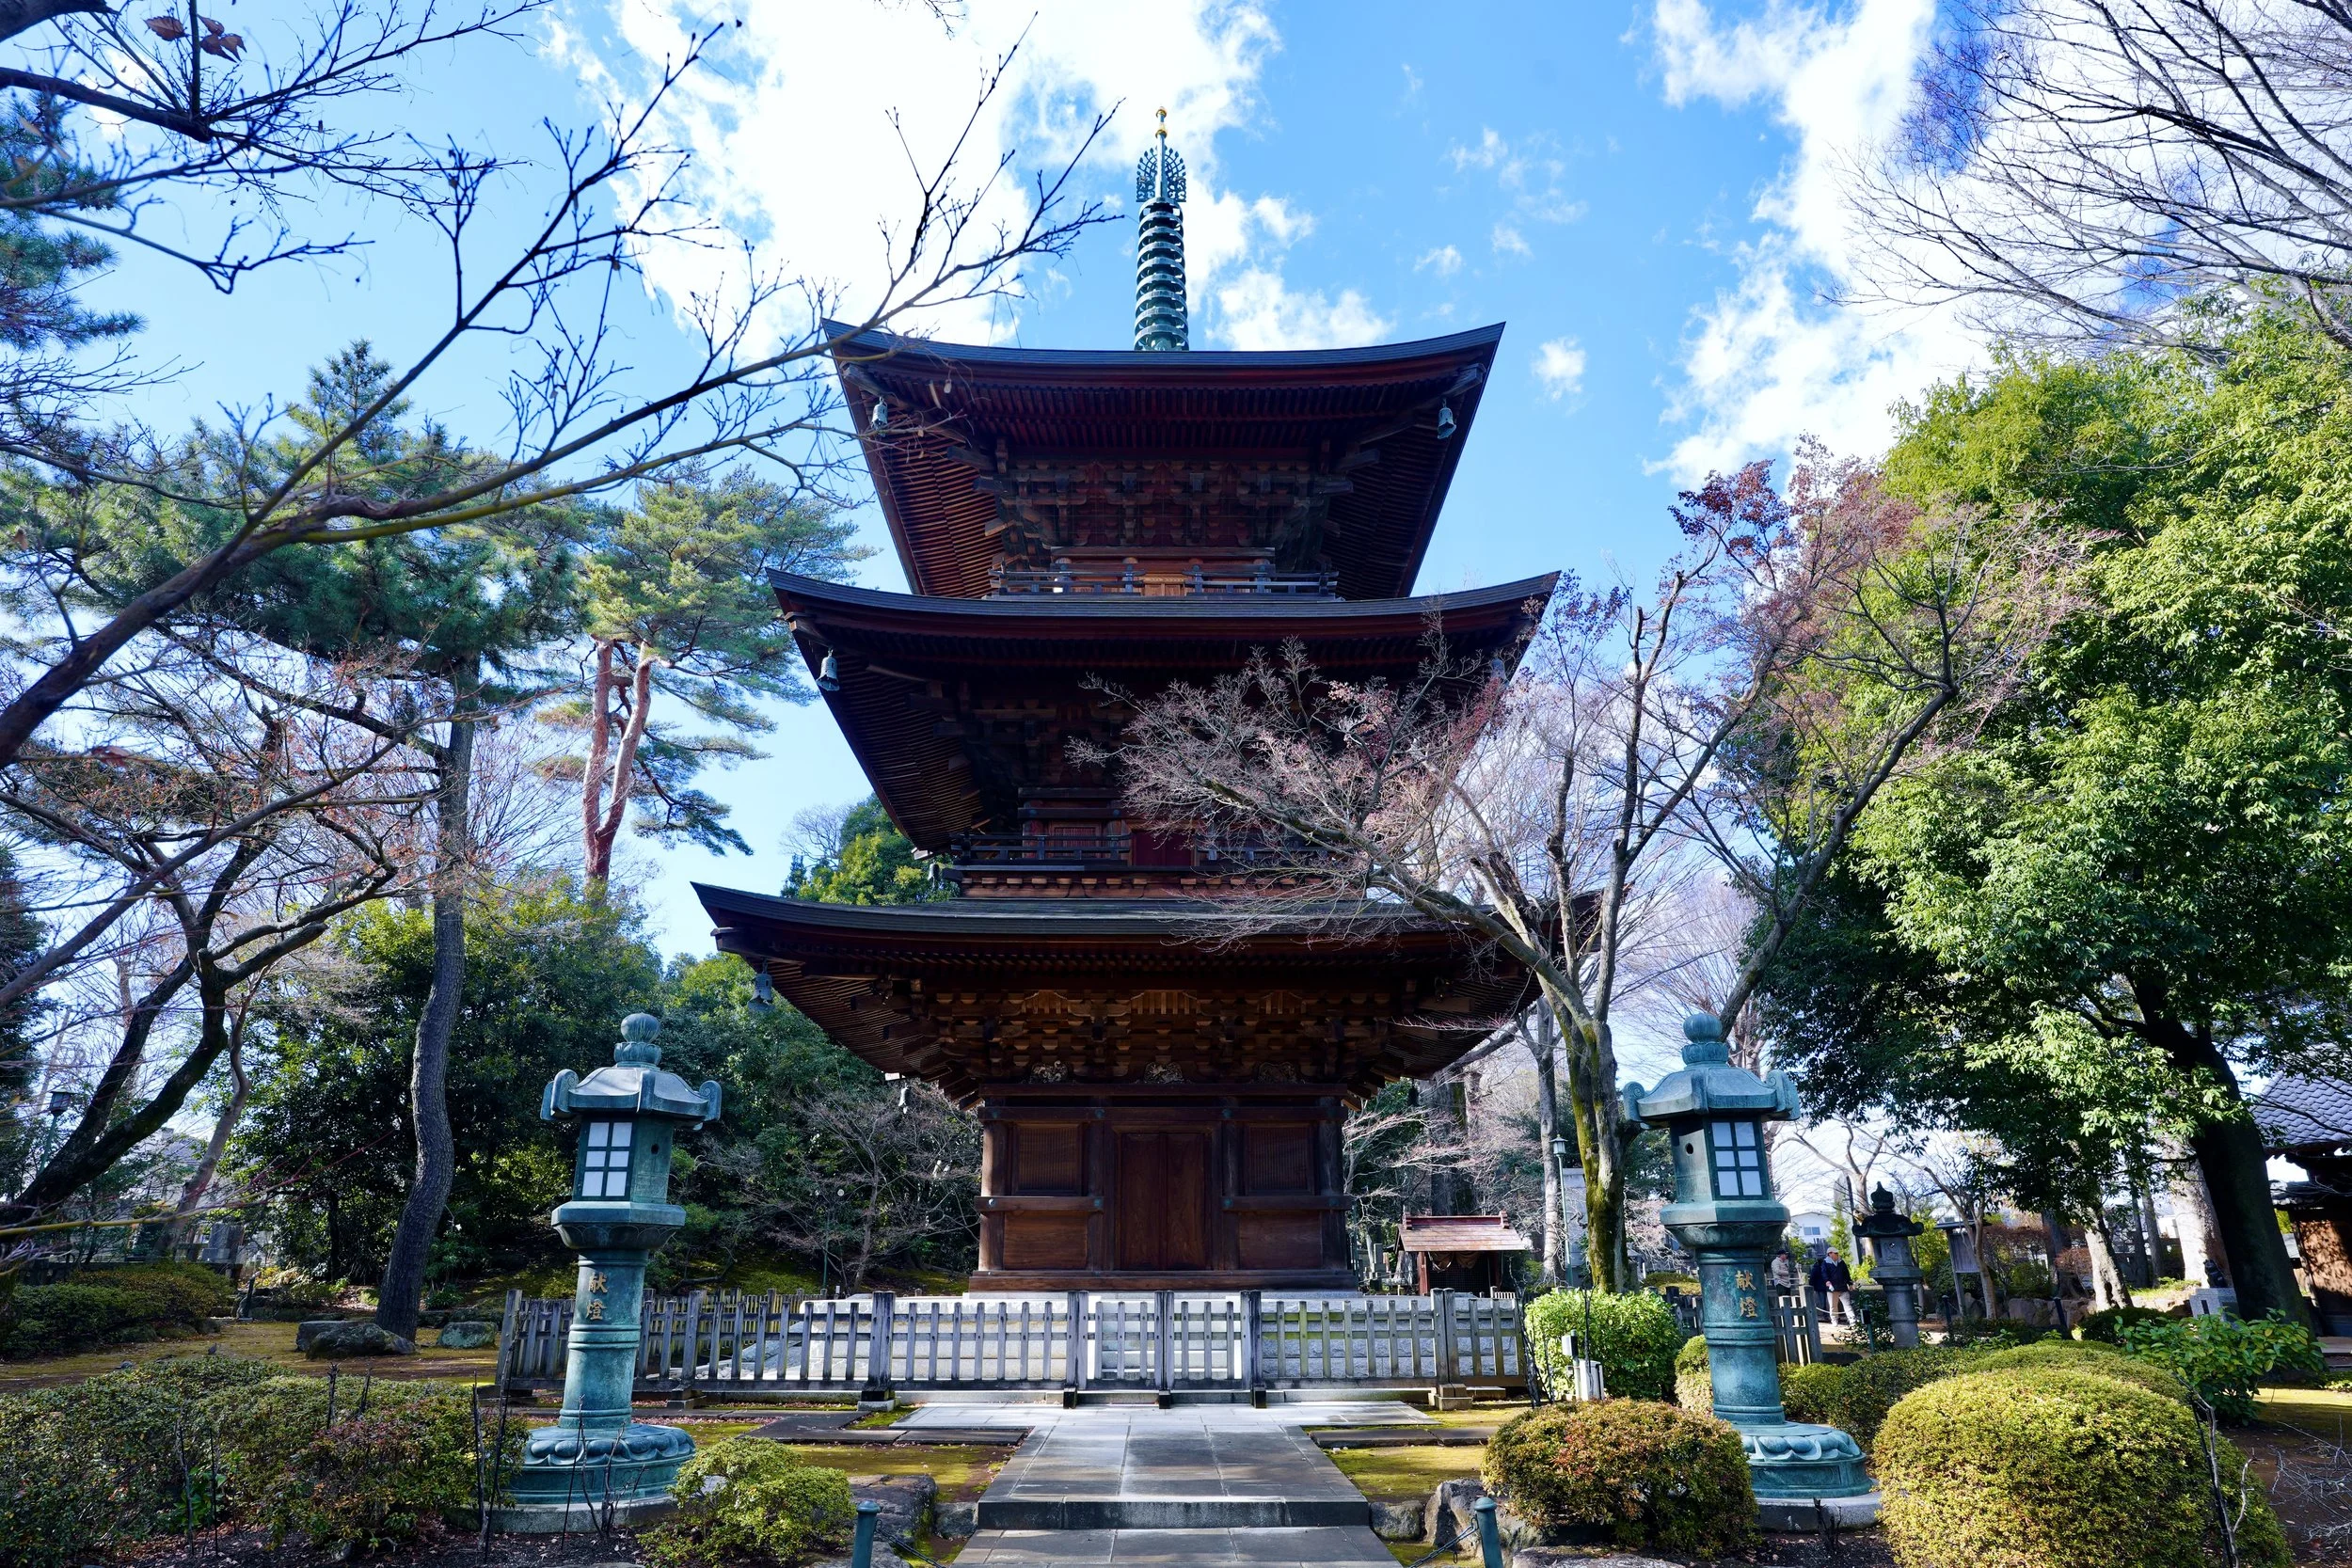
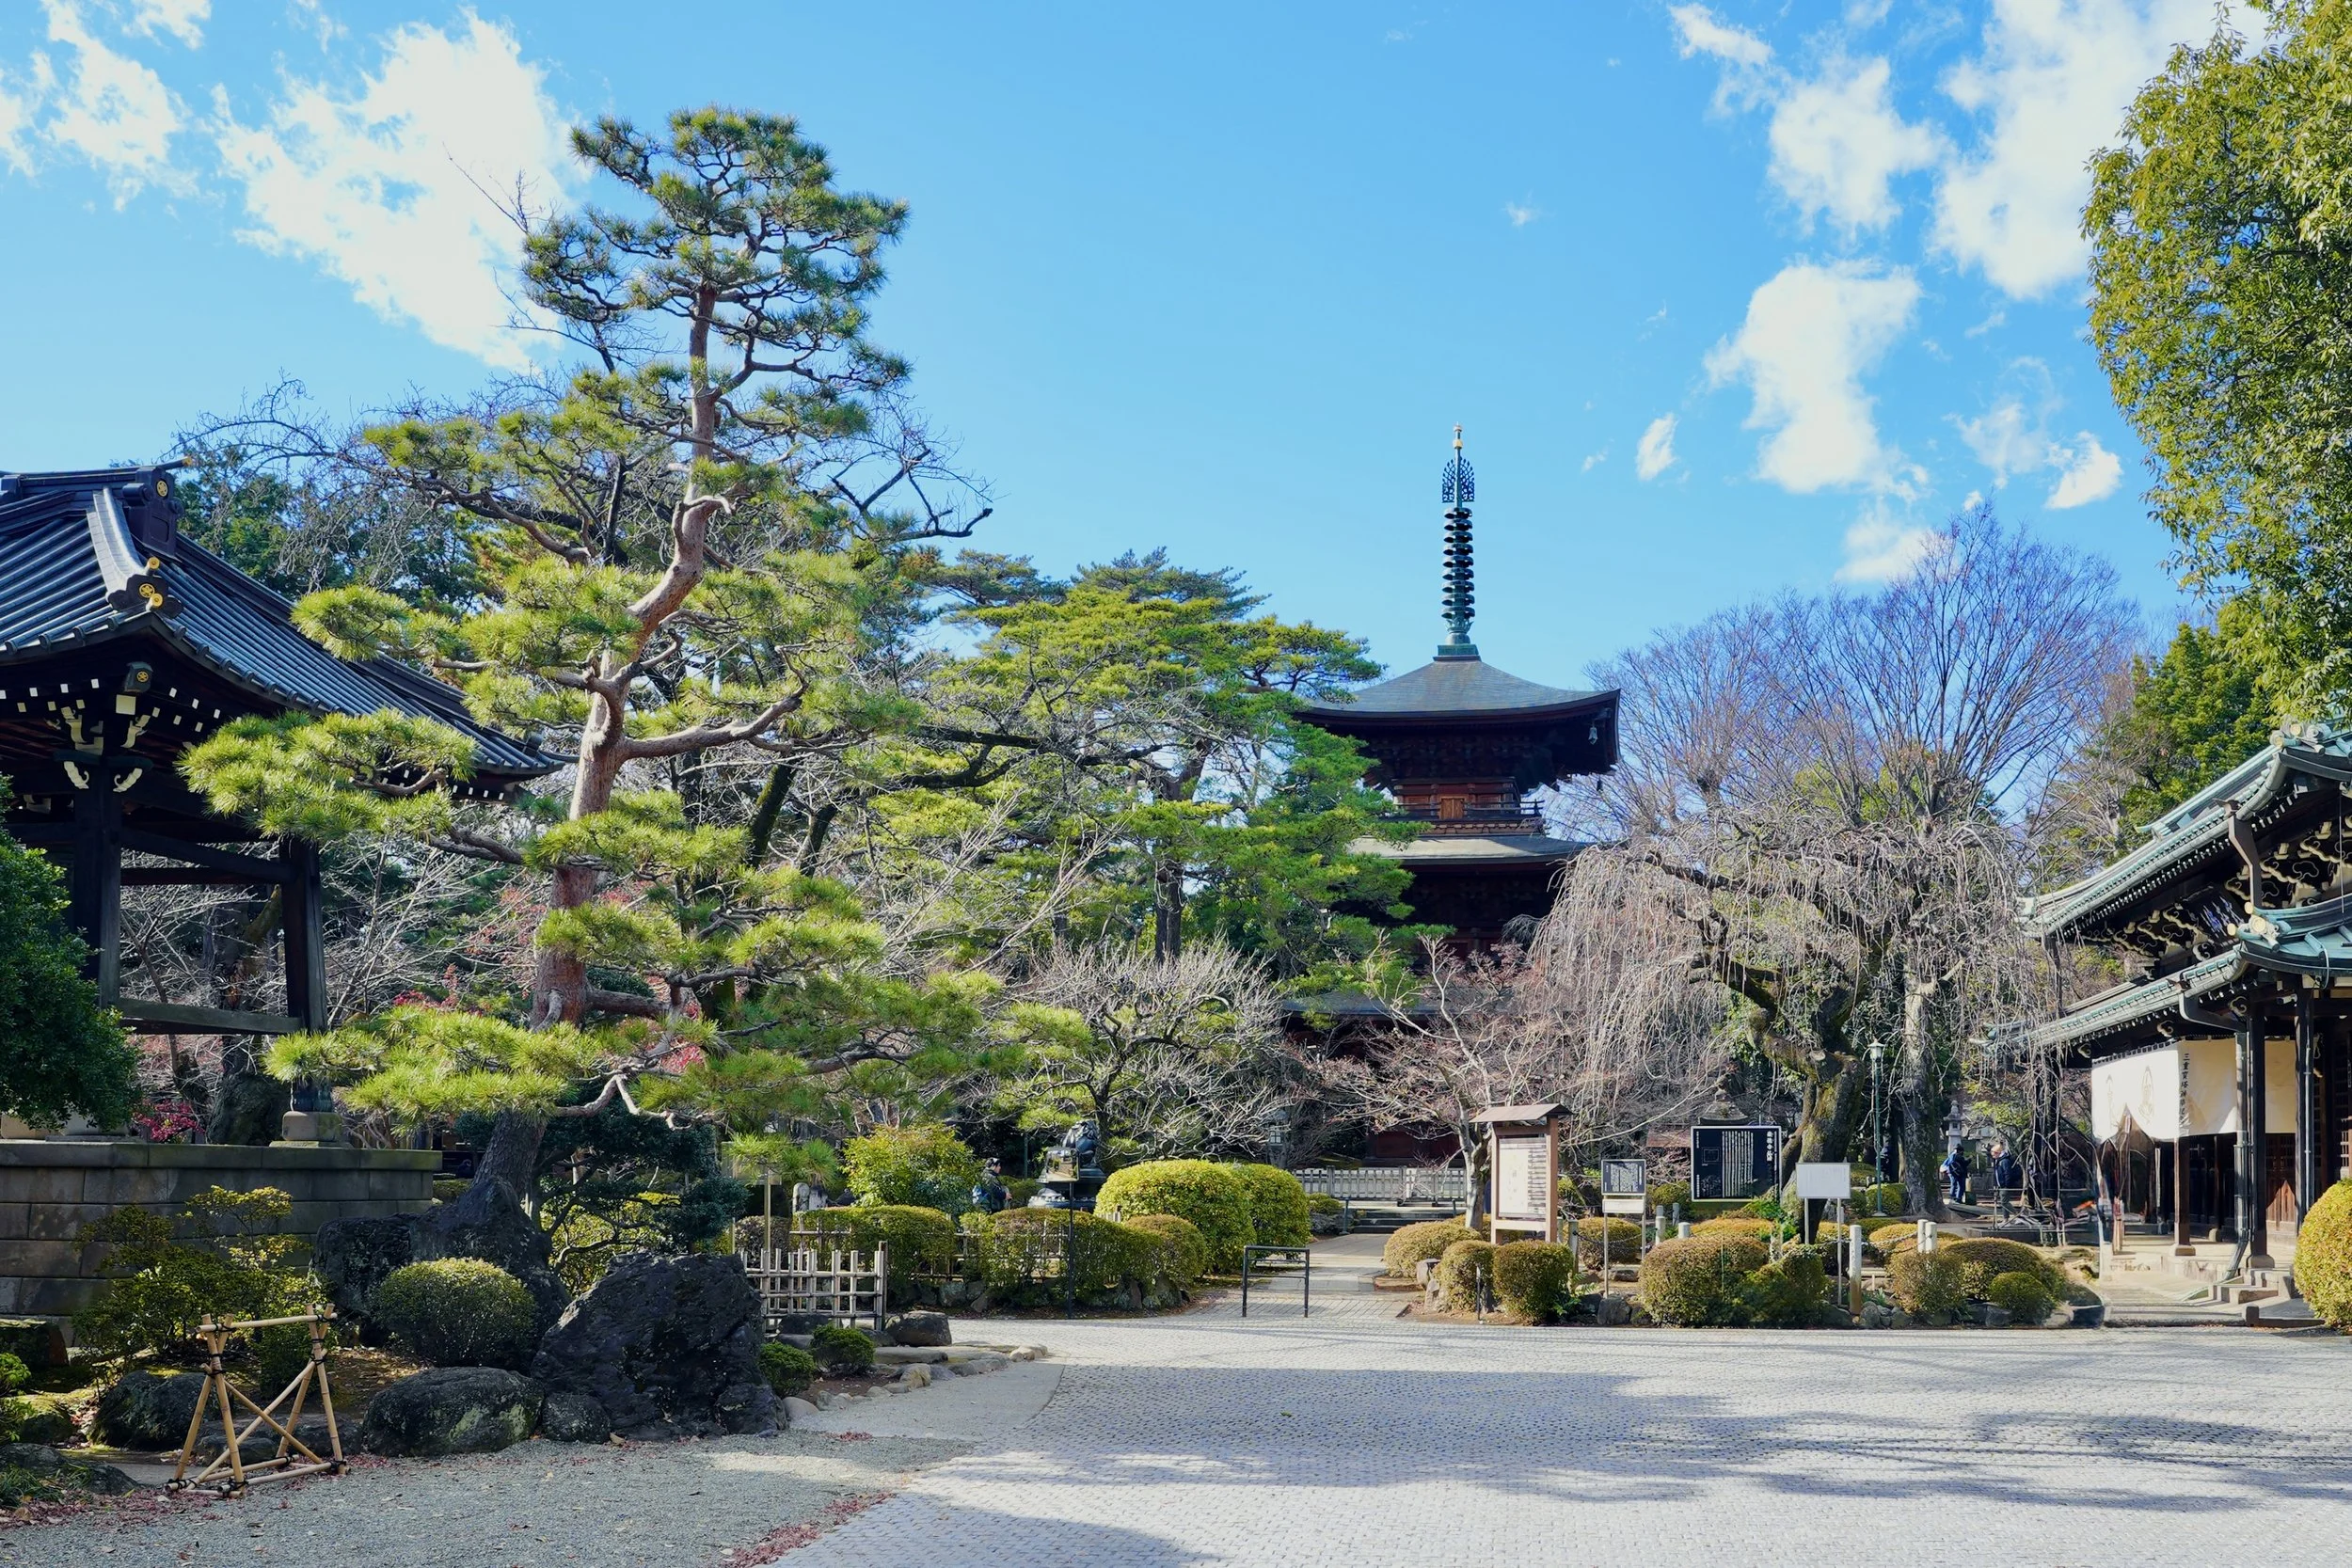
Layers of time stacked like iterations—each tier a refinement, not a reinvention
Then the pagoda rises, tier by tier, as if the city decided to show you how patience looks. In Tokyo, everything else is optimized for speed: trains, walking rhythms, convenience stores that appear exactly when you need one. But here, you can feel a different KPI—continuity. Centuries of “good enough” made better, one careful adjustment at a time.
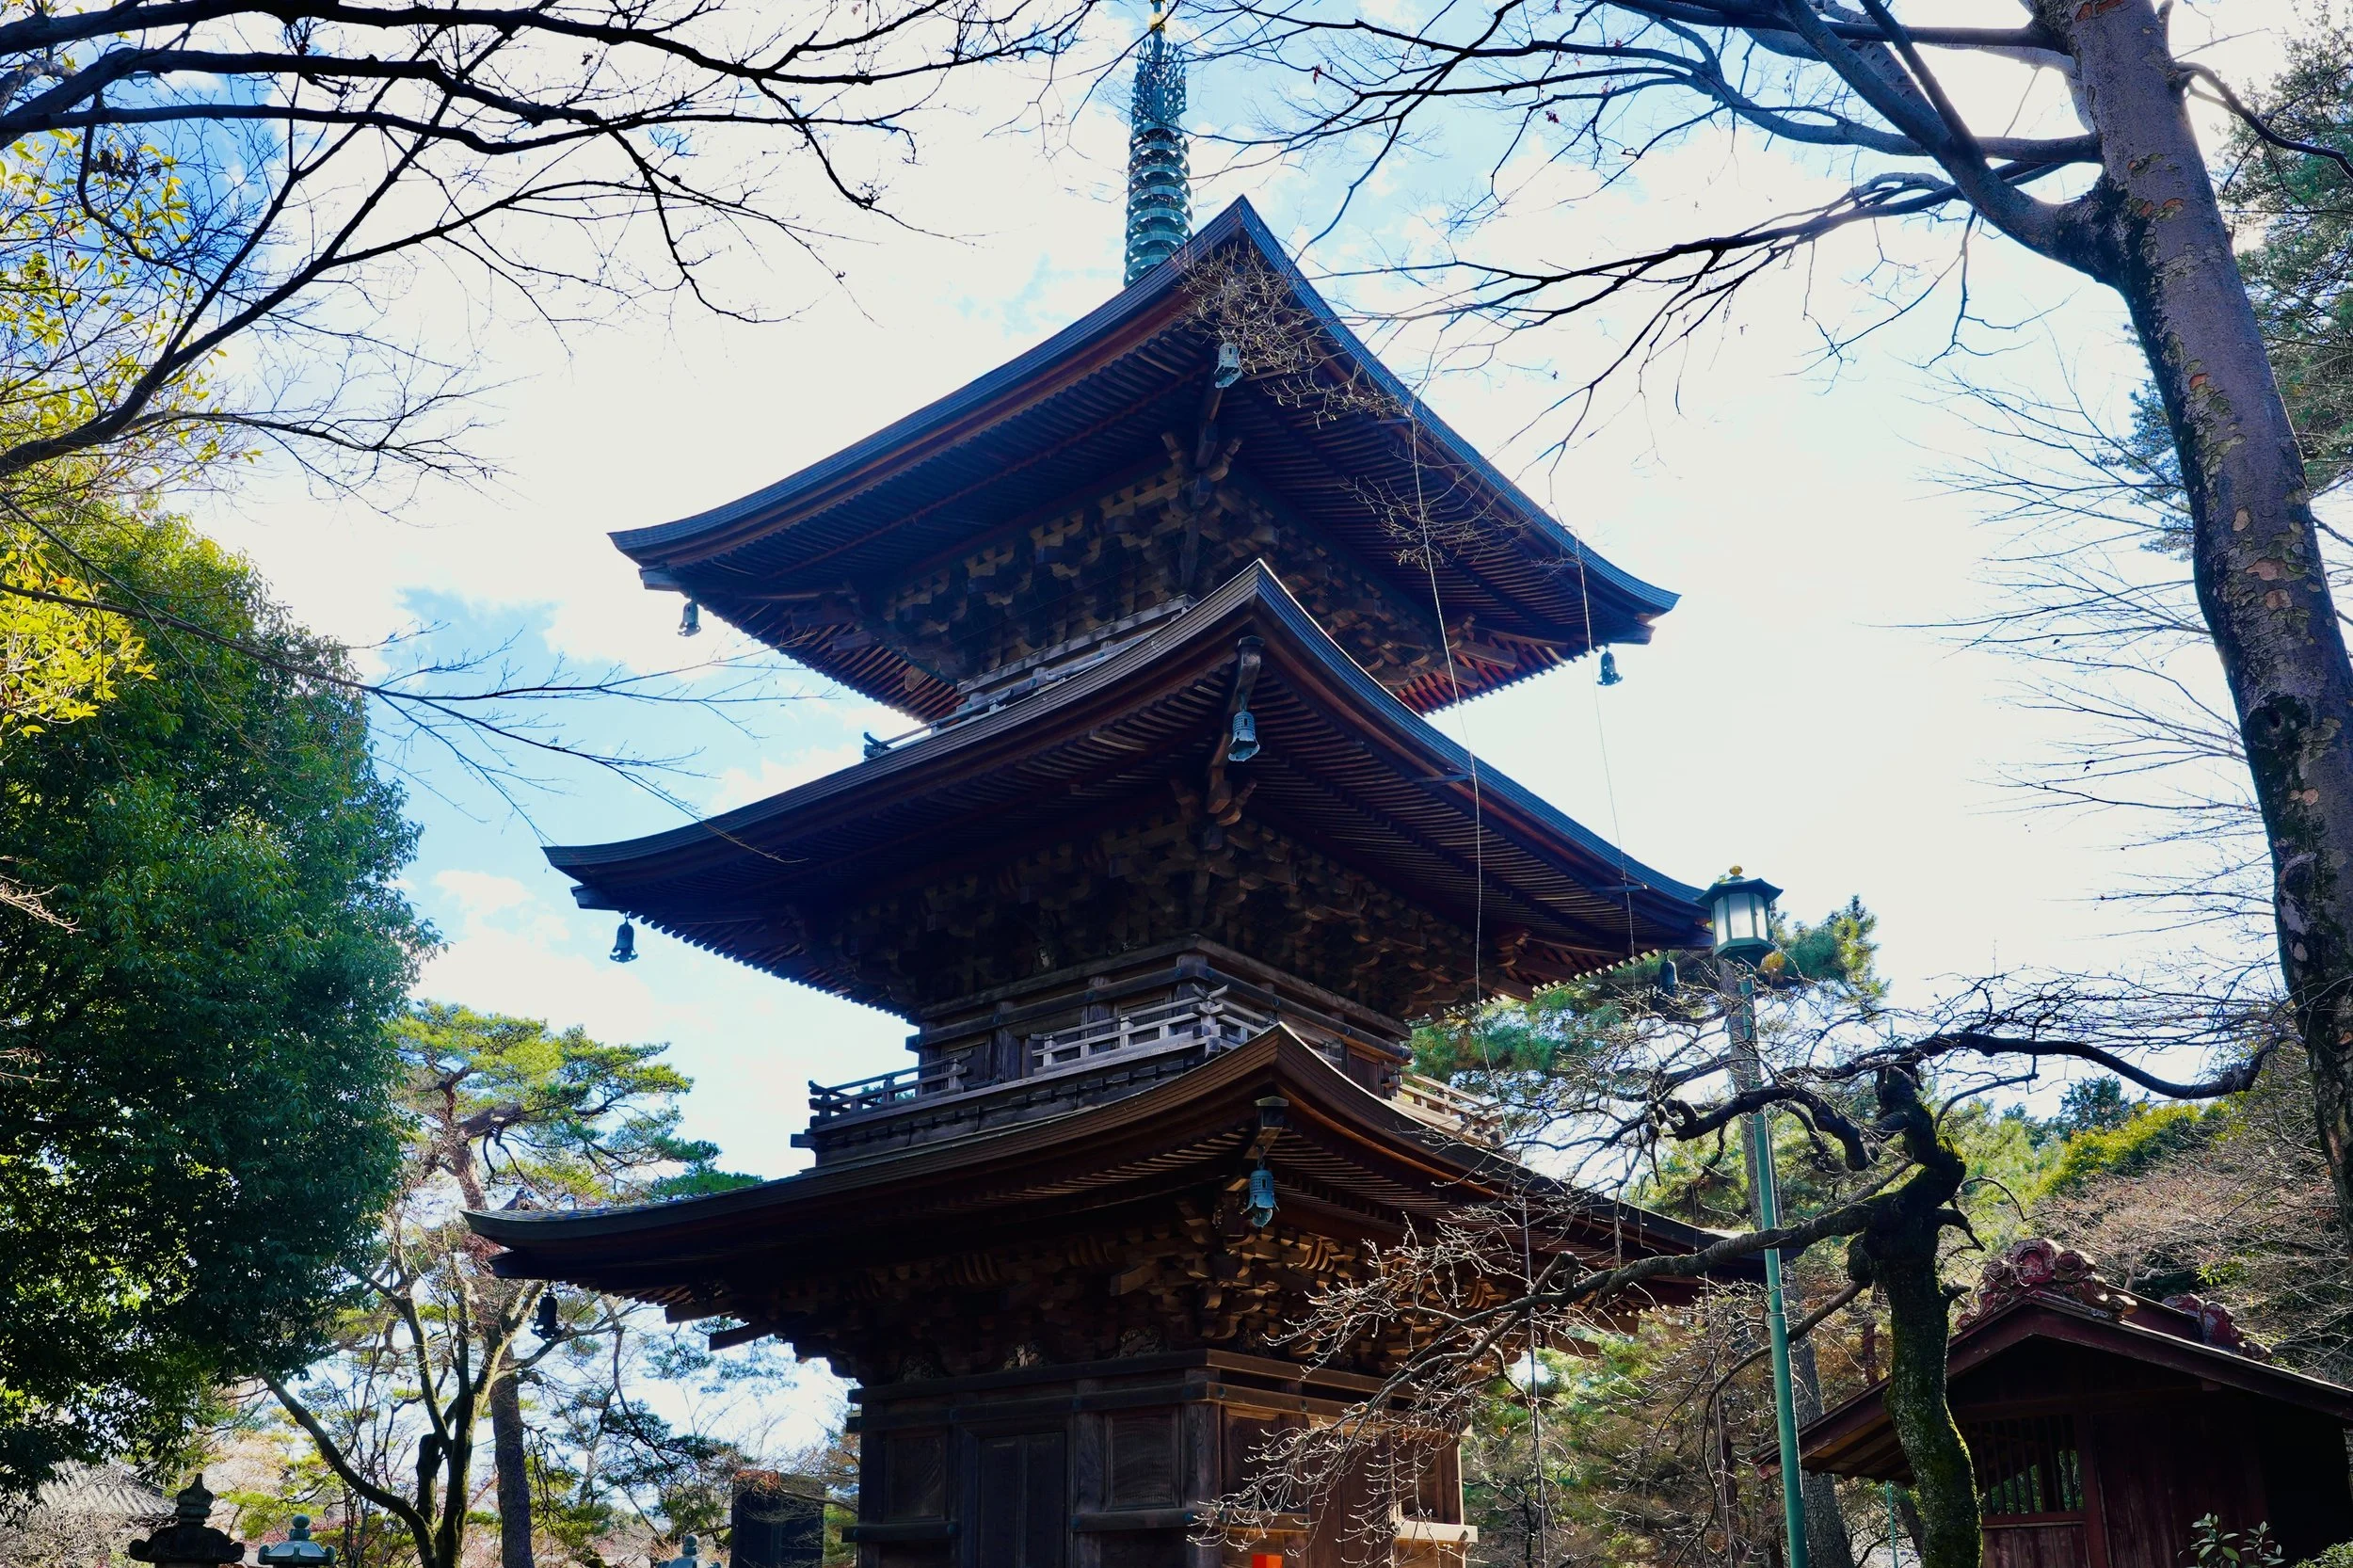
A structure that feels like an algorithm: stable, repeatable, quietly exact
If Tokyo is a system with constant throughput, this place is a controlled experiment. The noise floor drops. The variance tightens. Even your thoughts feel less scattered, like they’re finally converging.
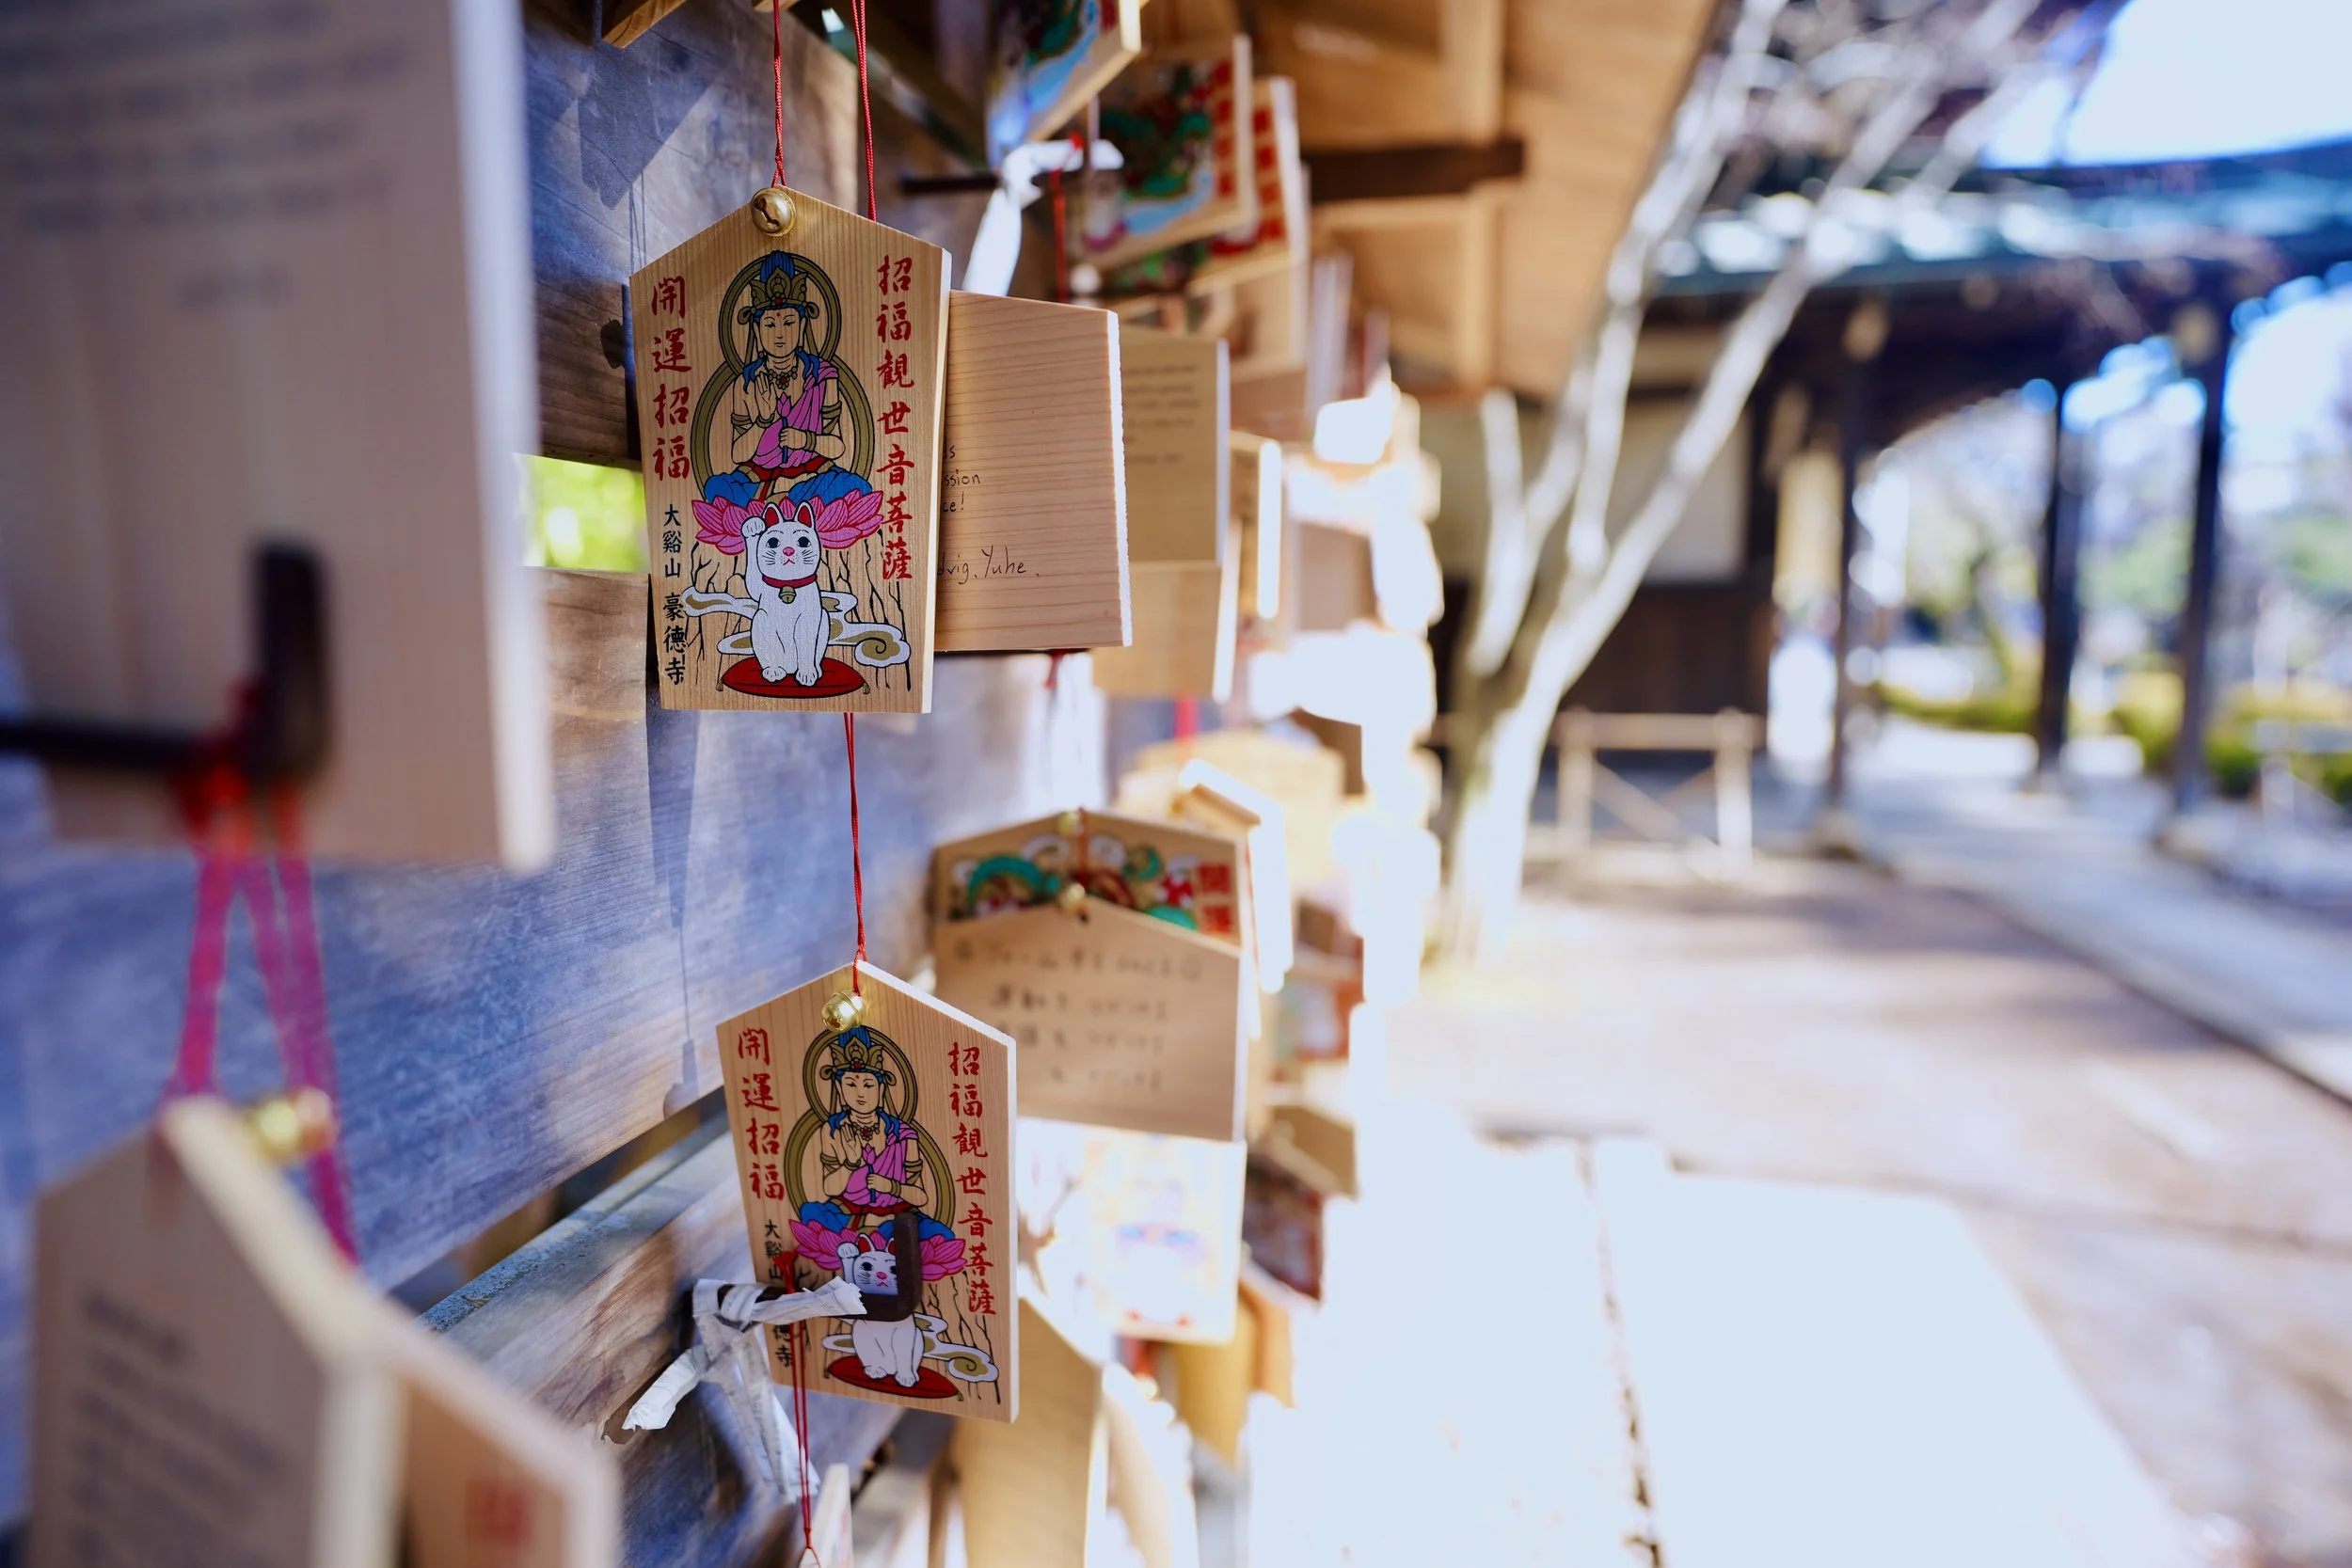
Structured format, unstructured hopes—tiny data points of human longing
The ema plaques are the part that always gets me. They’re basically a dataset: same shape, same hanging method, same location—yet each one contains a different narrative. This is the difference between schema and meaning. You can standardize the container, but what people pour into it stays irreducibly human.
And then there are the cats.
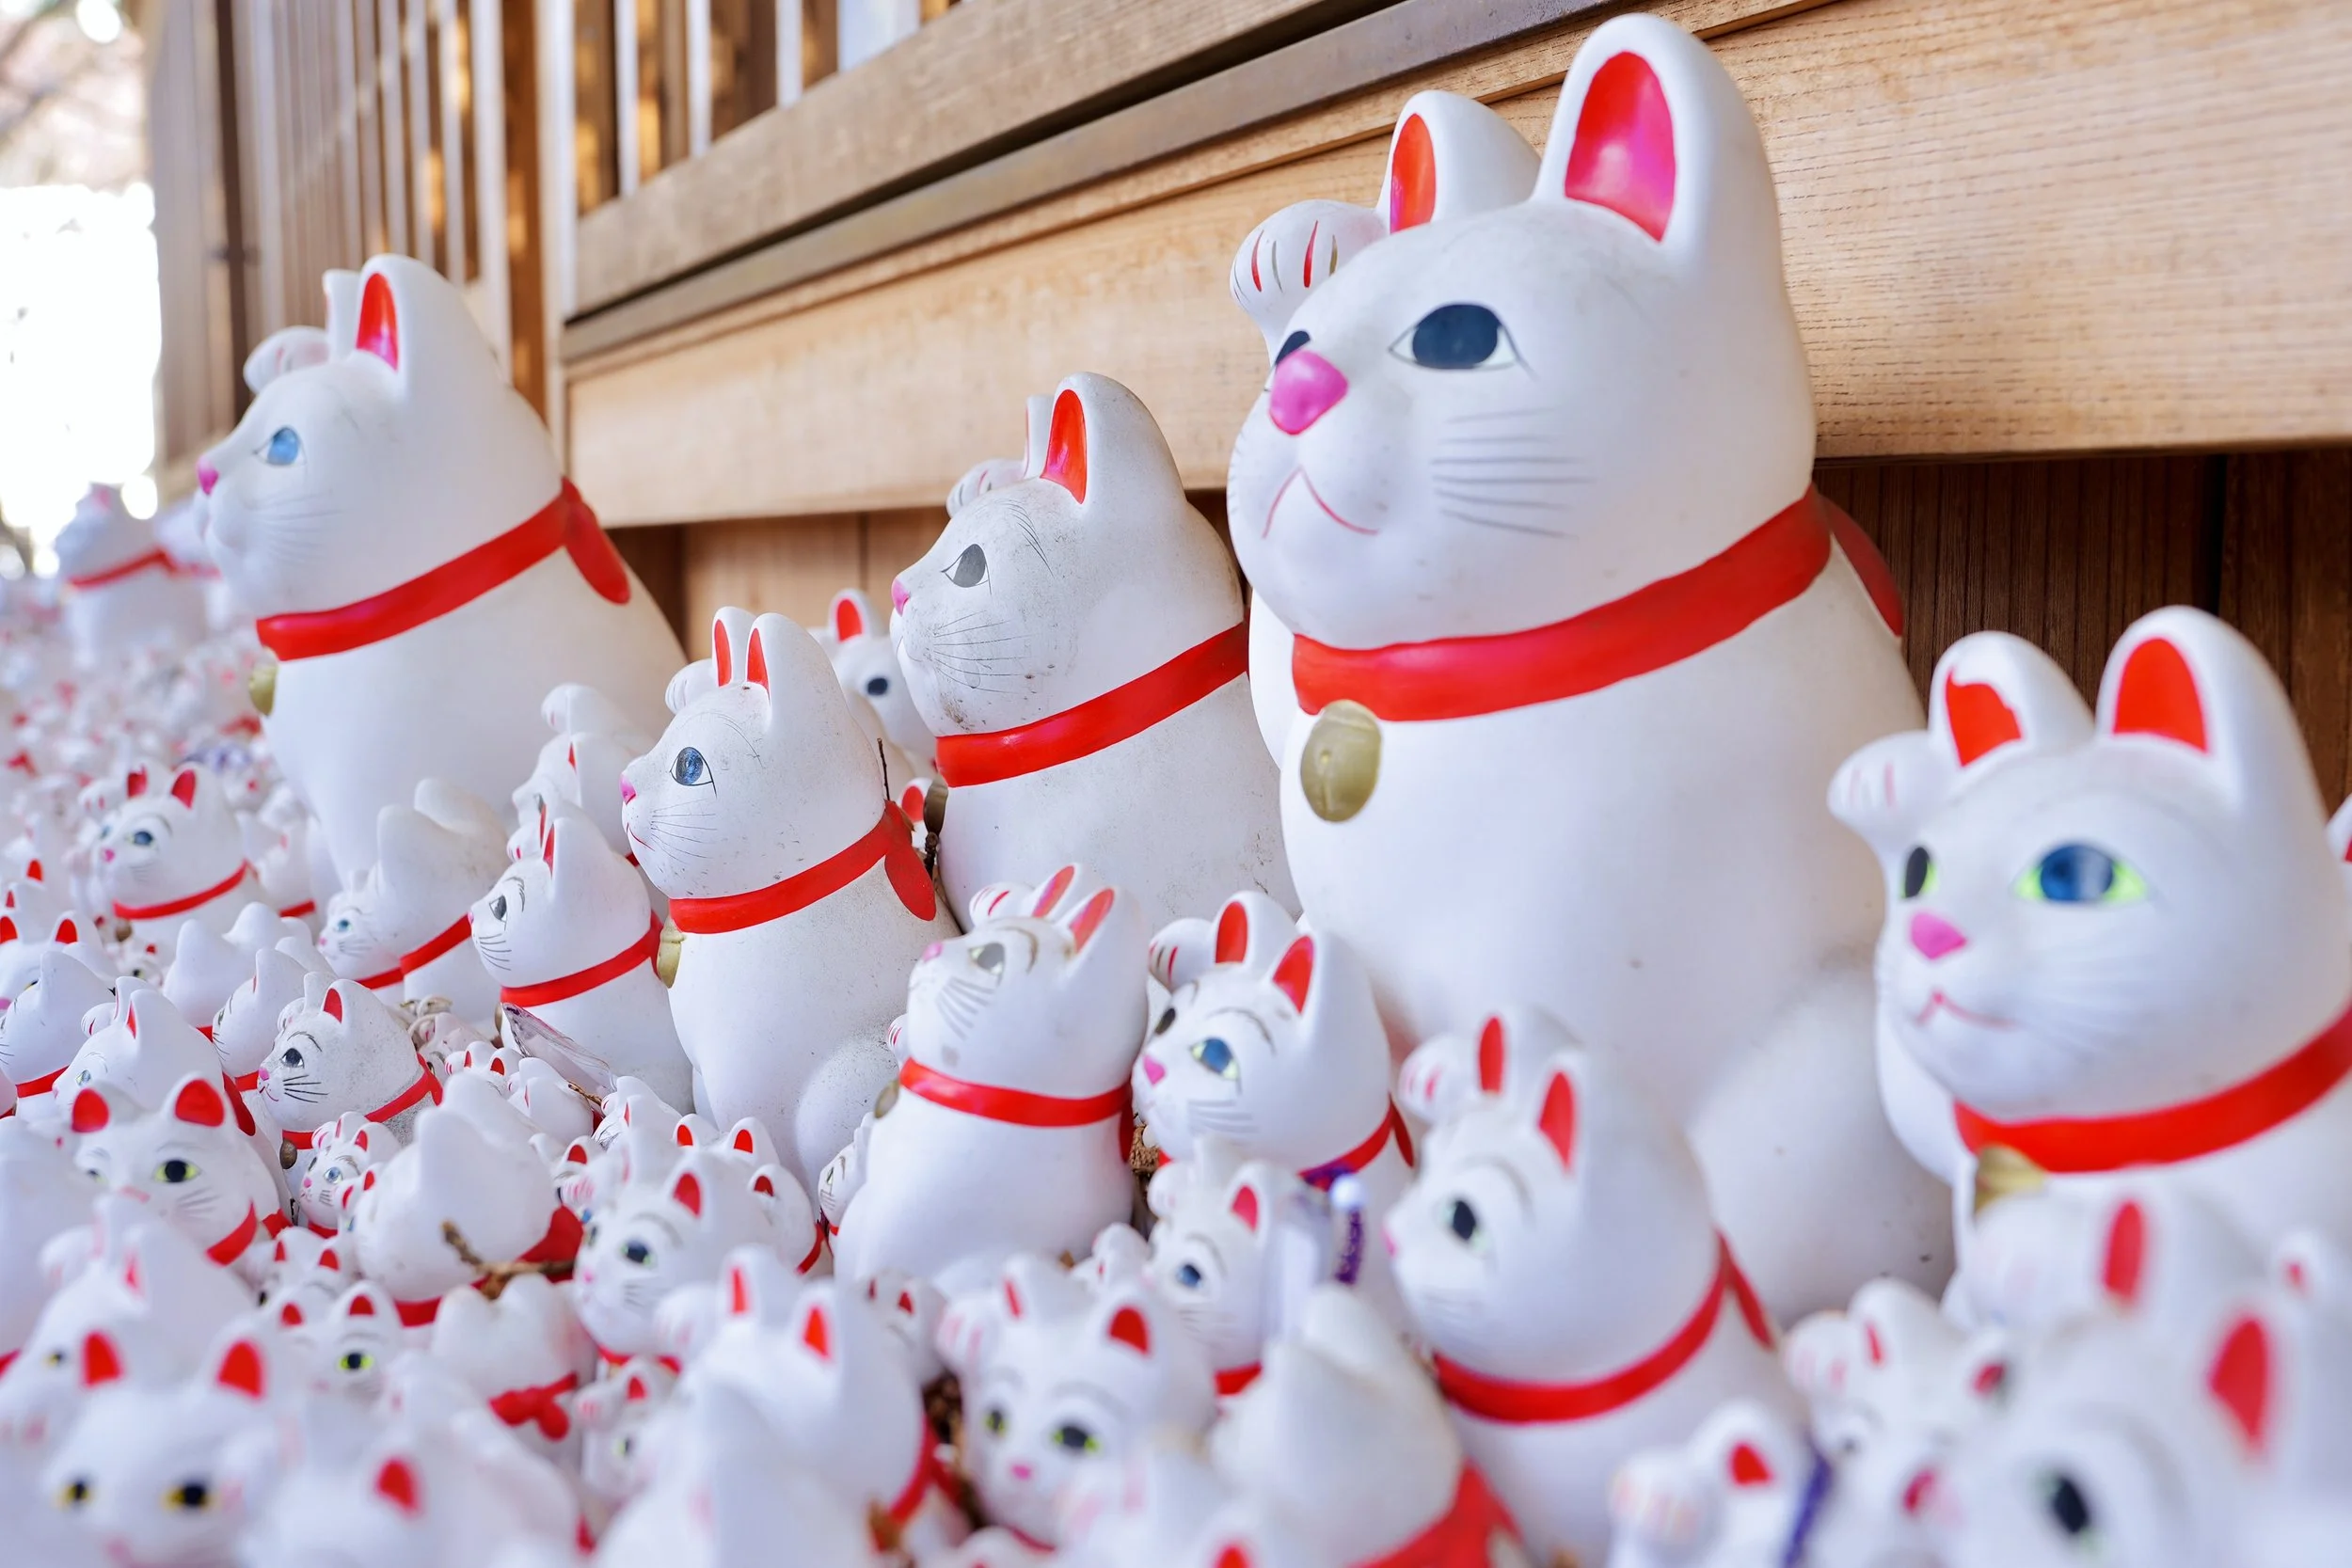
One becomes a story. Hundreds become a pattern
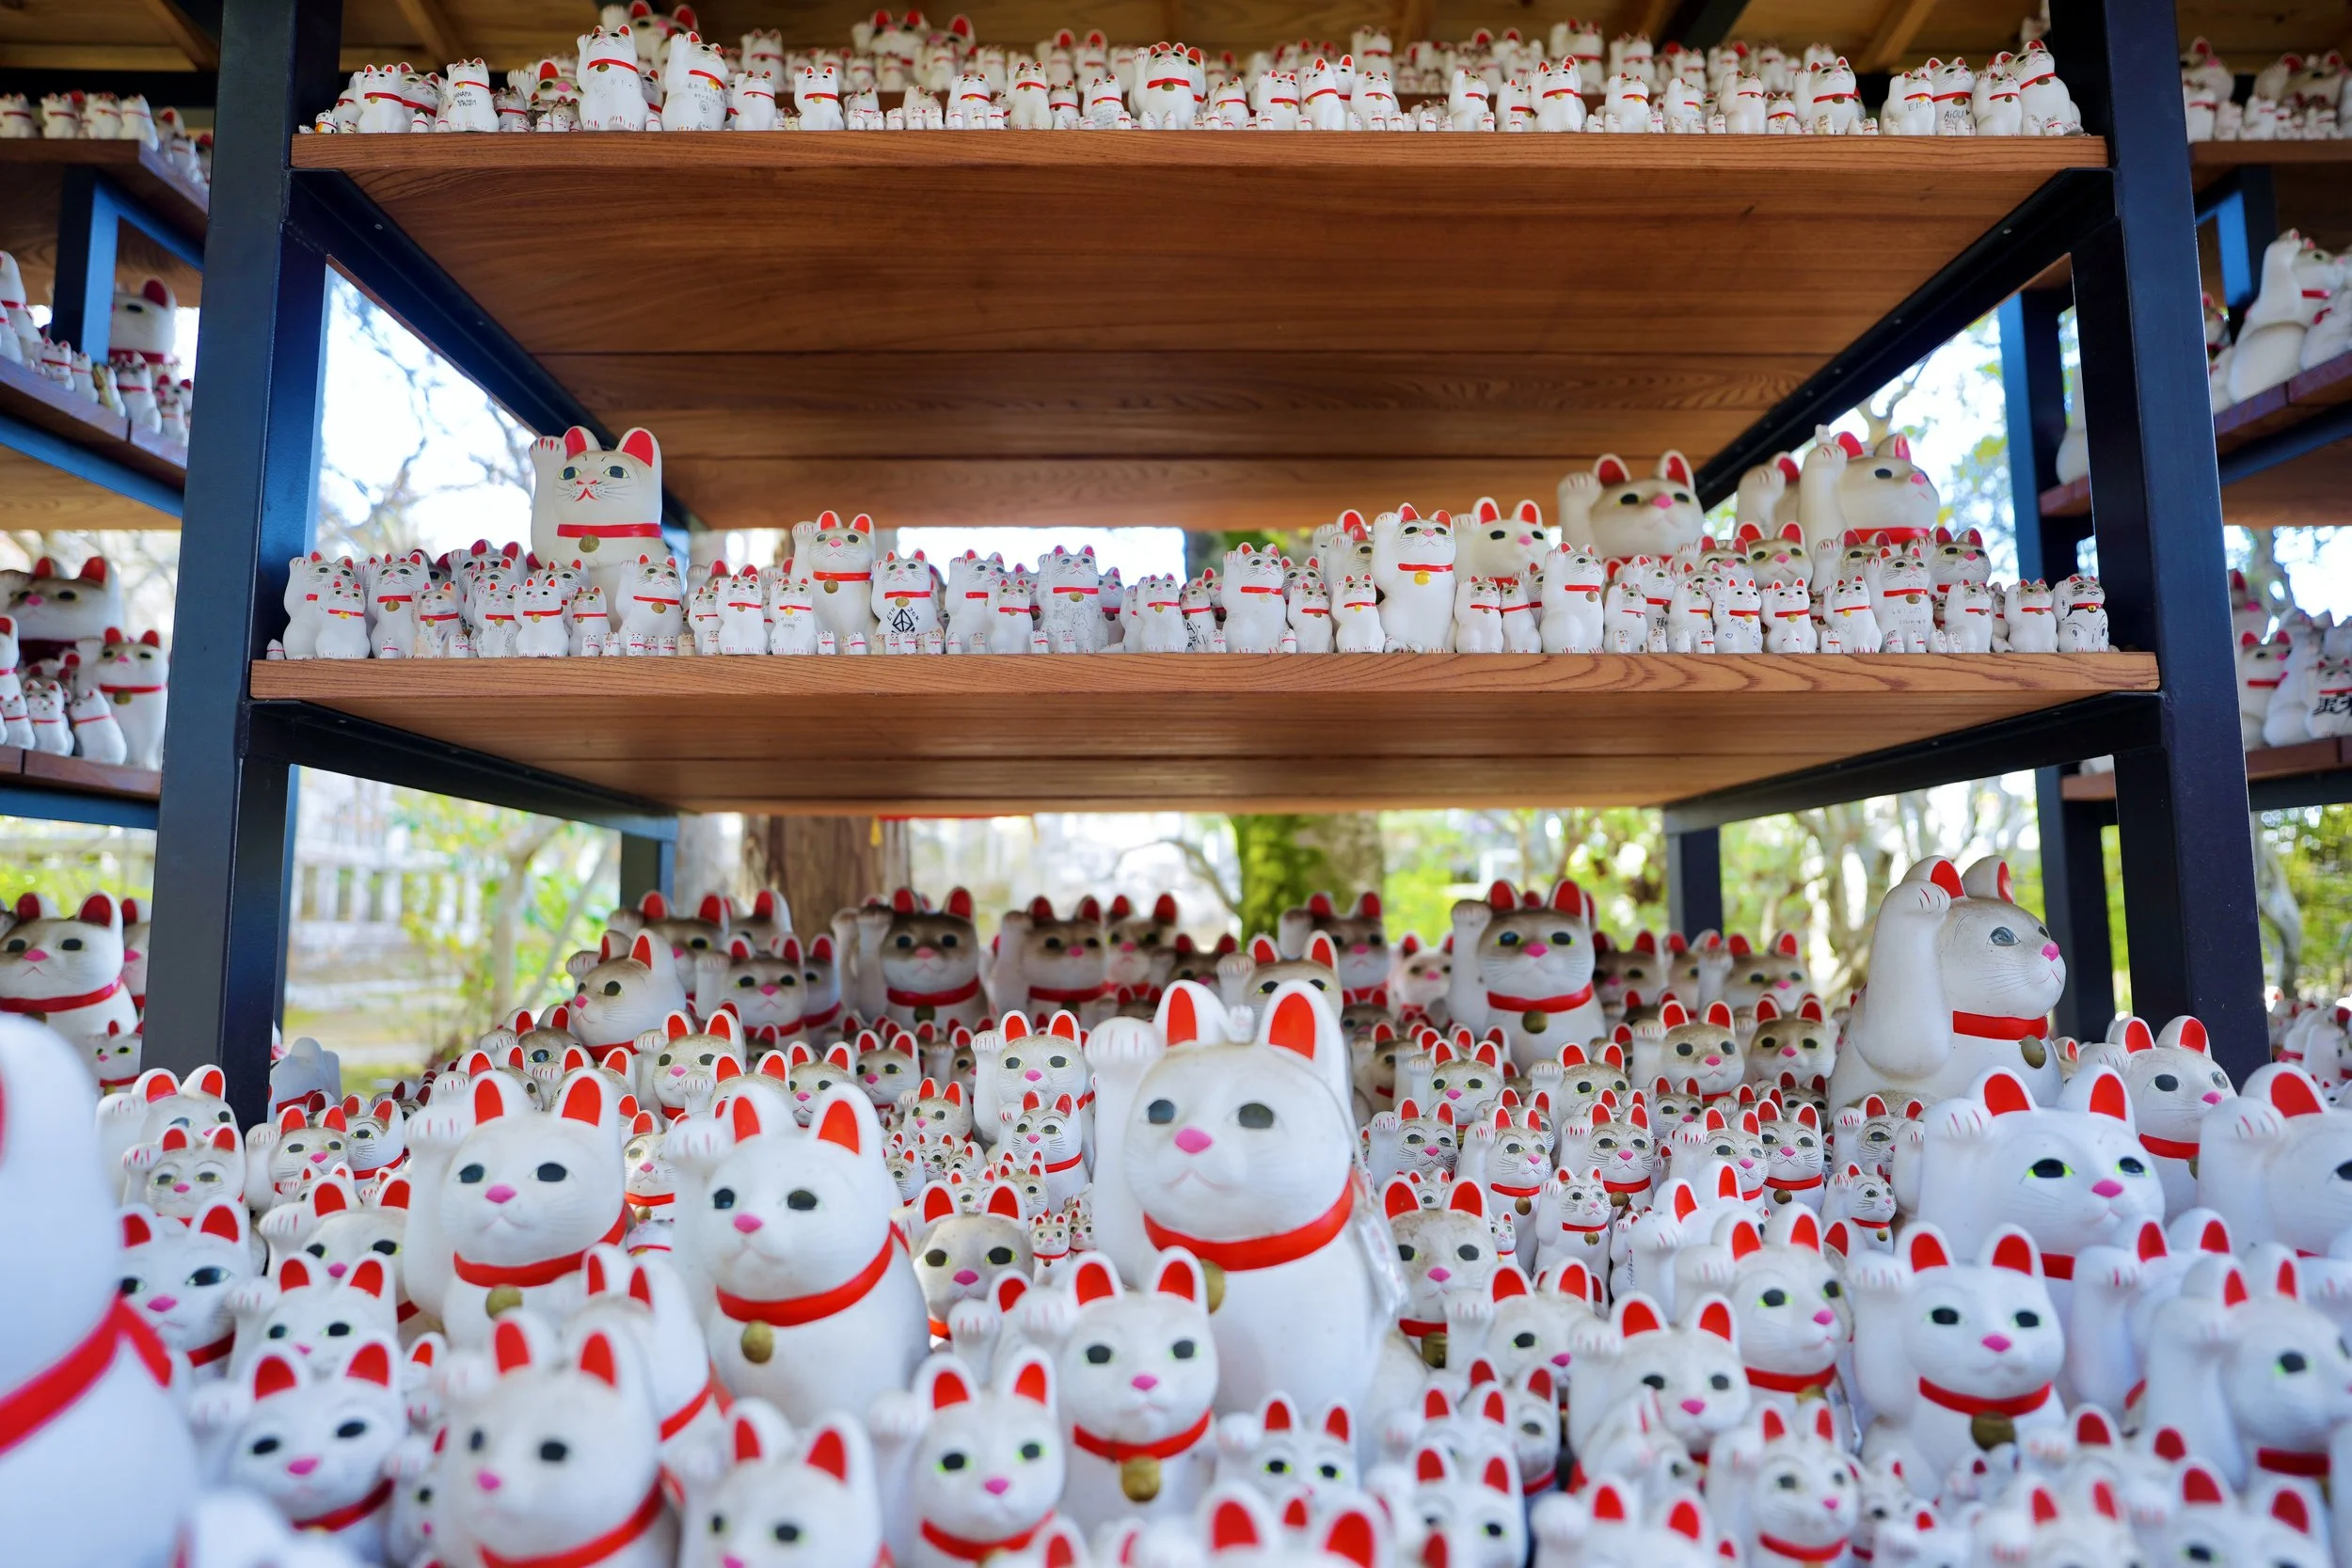
A distribution you can see: repetition, variation, and a whole lot of hope
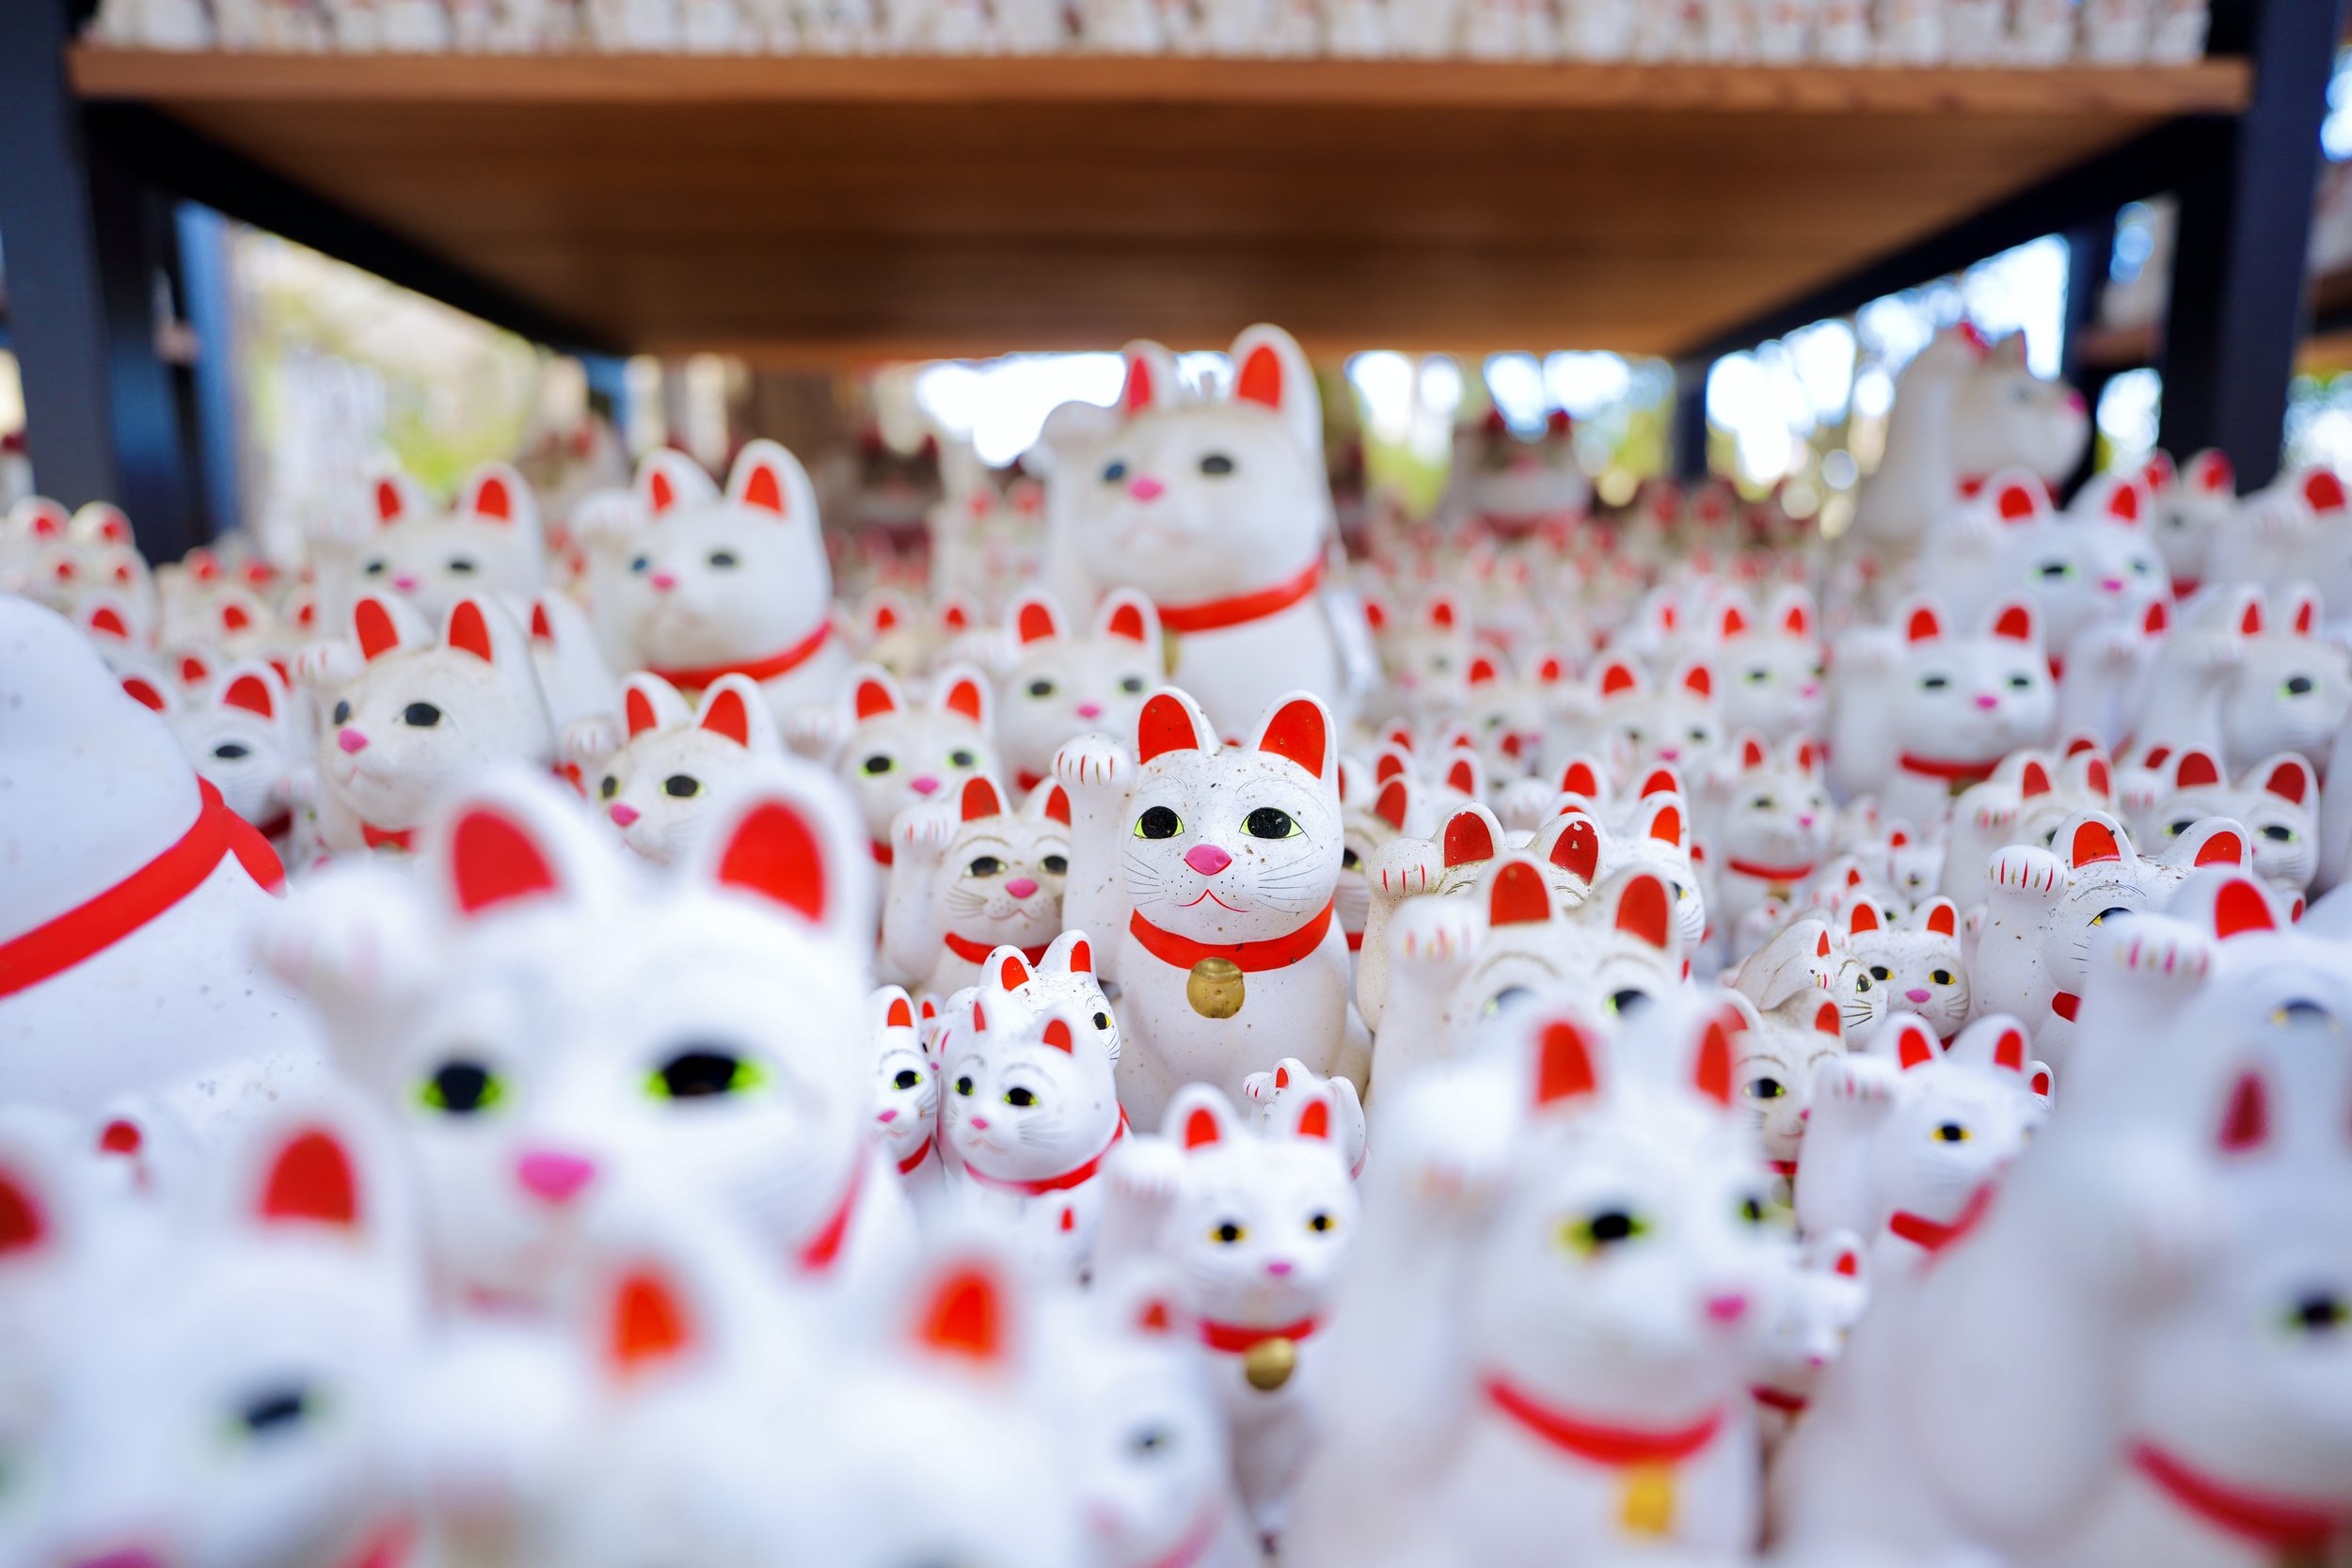
A single signal highlighted against the noise—attention as a kind of filter
There are hundreds—maybe thousands—of maneki-neko arranged in rows, a visual lesson in aggregation. At the individual level, each cat is someone’s wish made physical. At scale, they become a trend line: faith repeated until it looks like a field. And the mind can’t help but do what it always does—look for structure. Clusters. Outliers. Tiny differences in paint, size, expression—proof that even “identical” things aren’t truly identical when you zoom in.
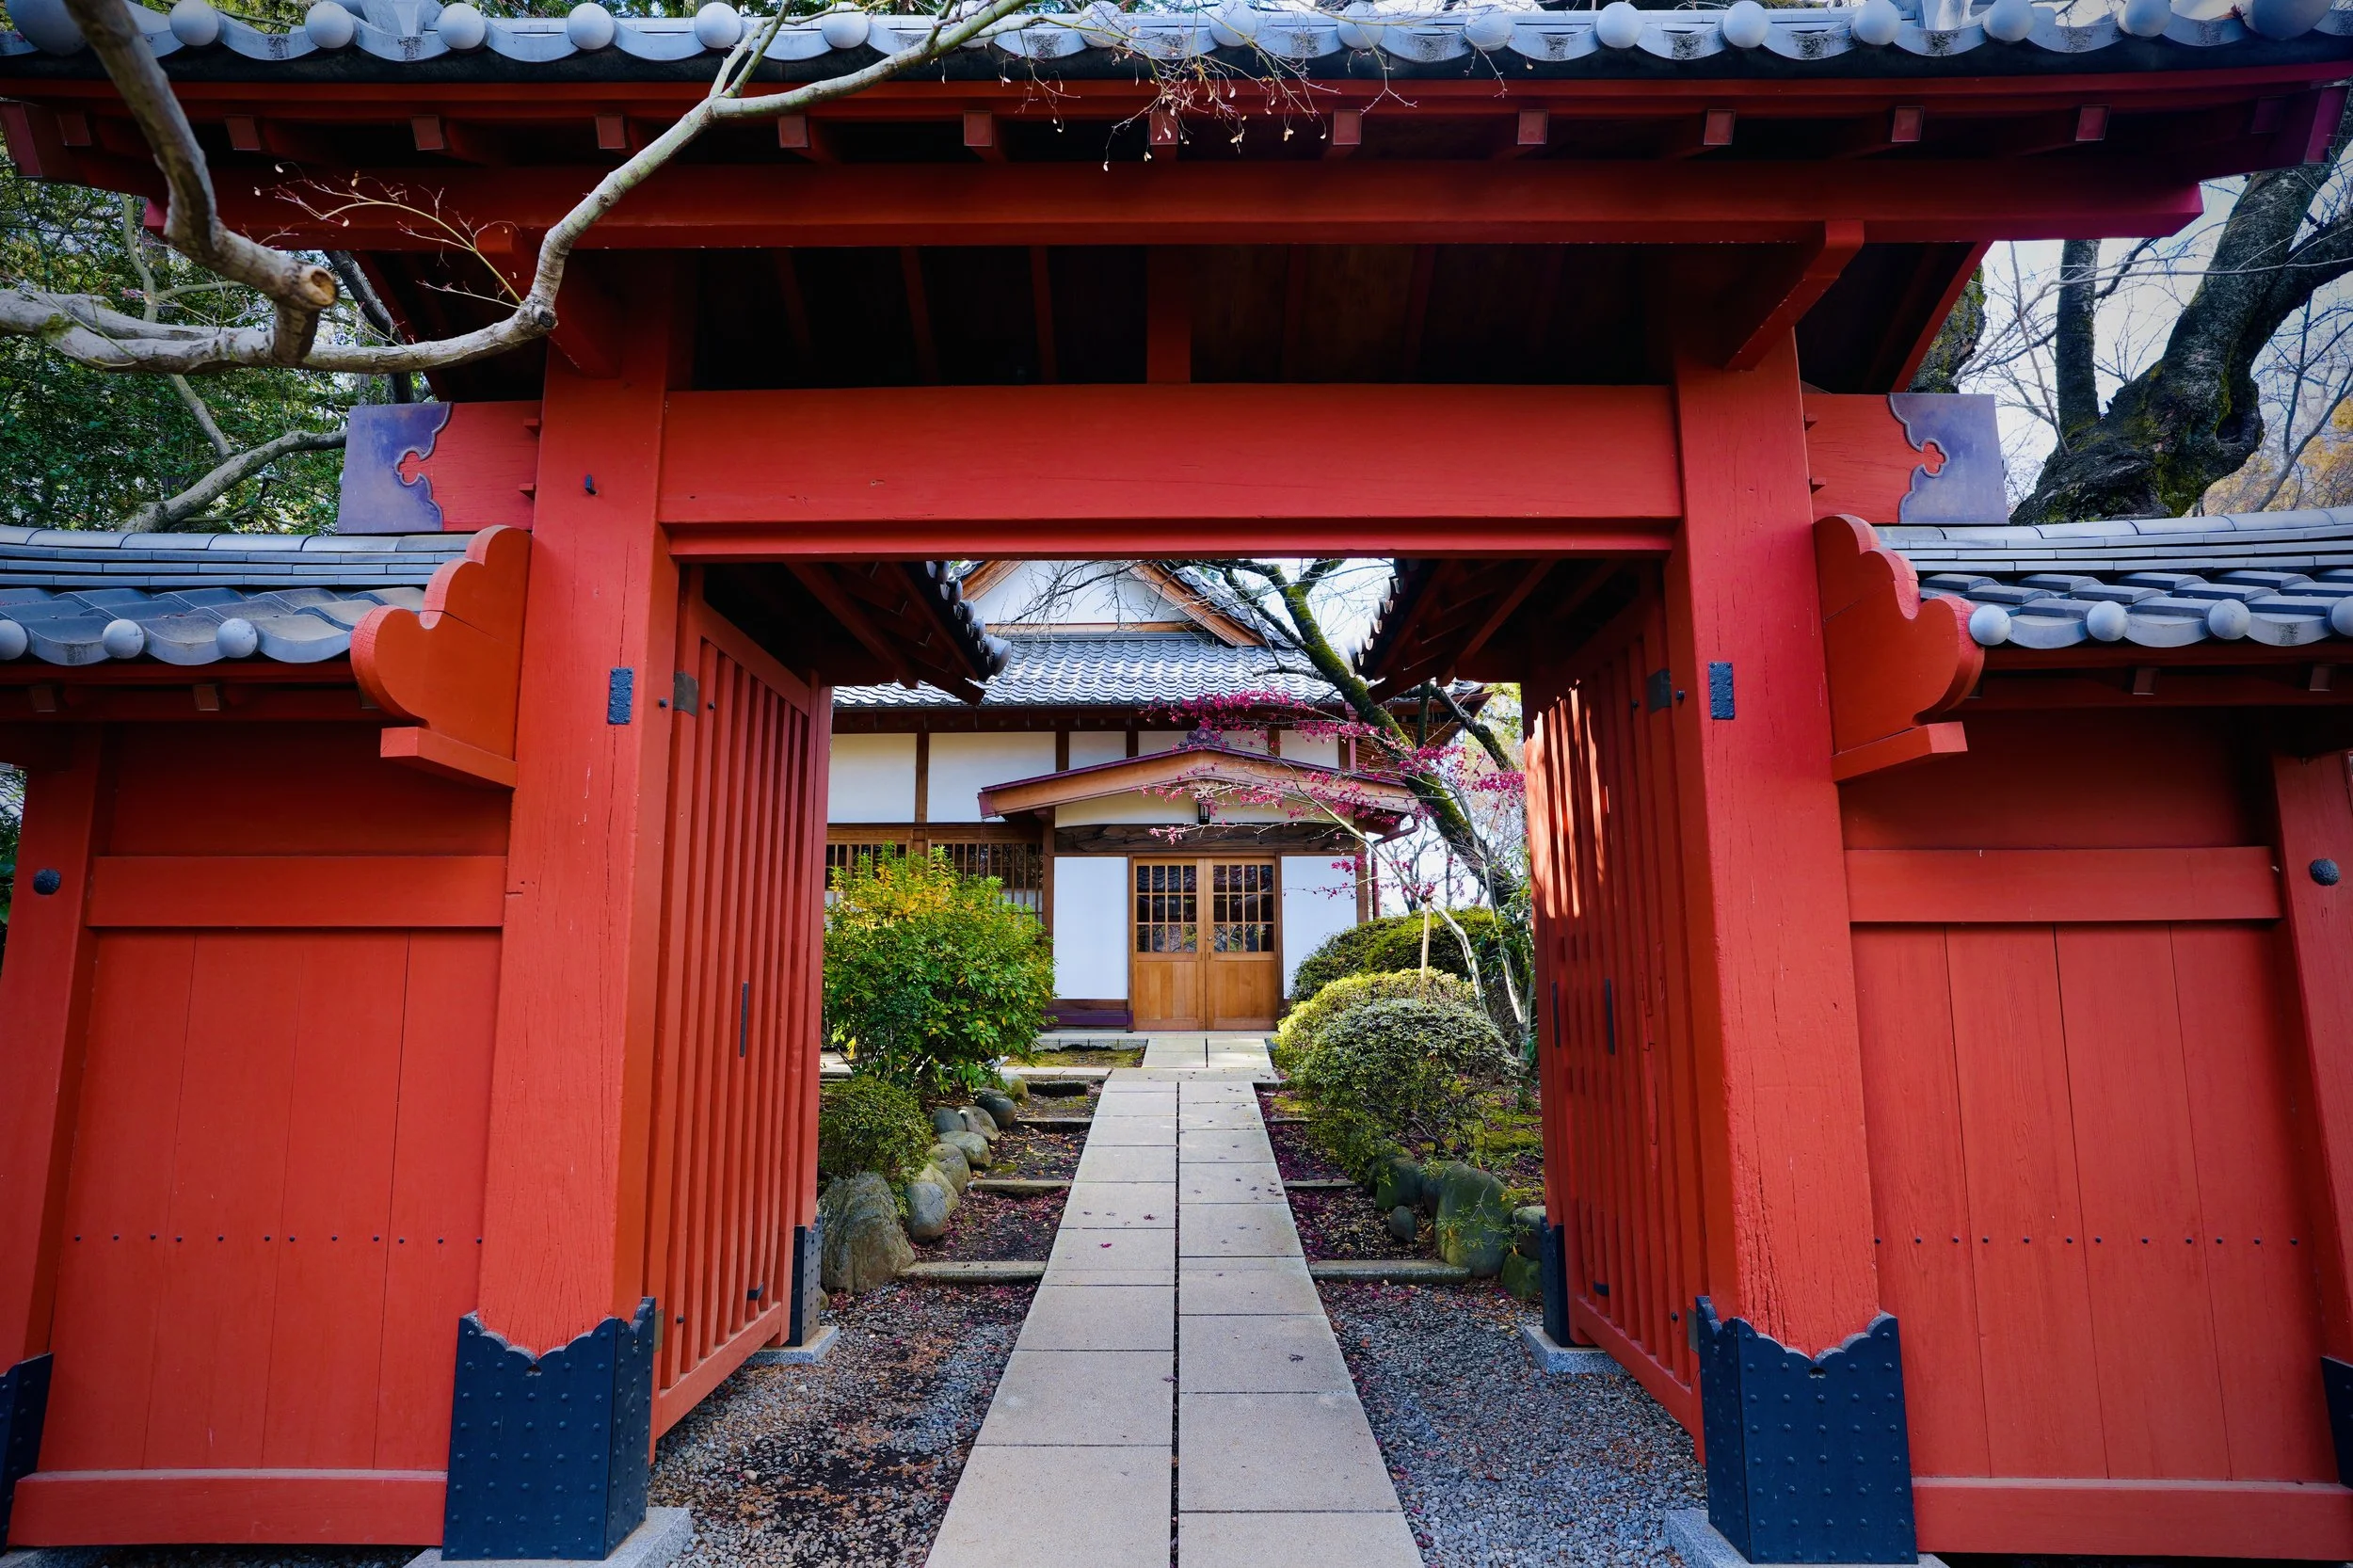
A threshold between two states: city mode and temple mode
A gate like this feels like switching contexts in code. On one side: Tokyo’s high-frequency pulse—ads, signage, schedules, streams of people moving like particles in a simulation. On the other: gravel, incense, trees, silence. Same city. Different regime.
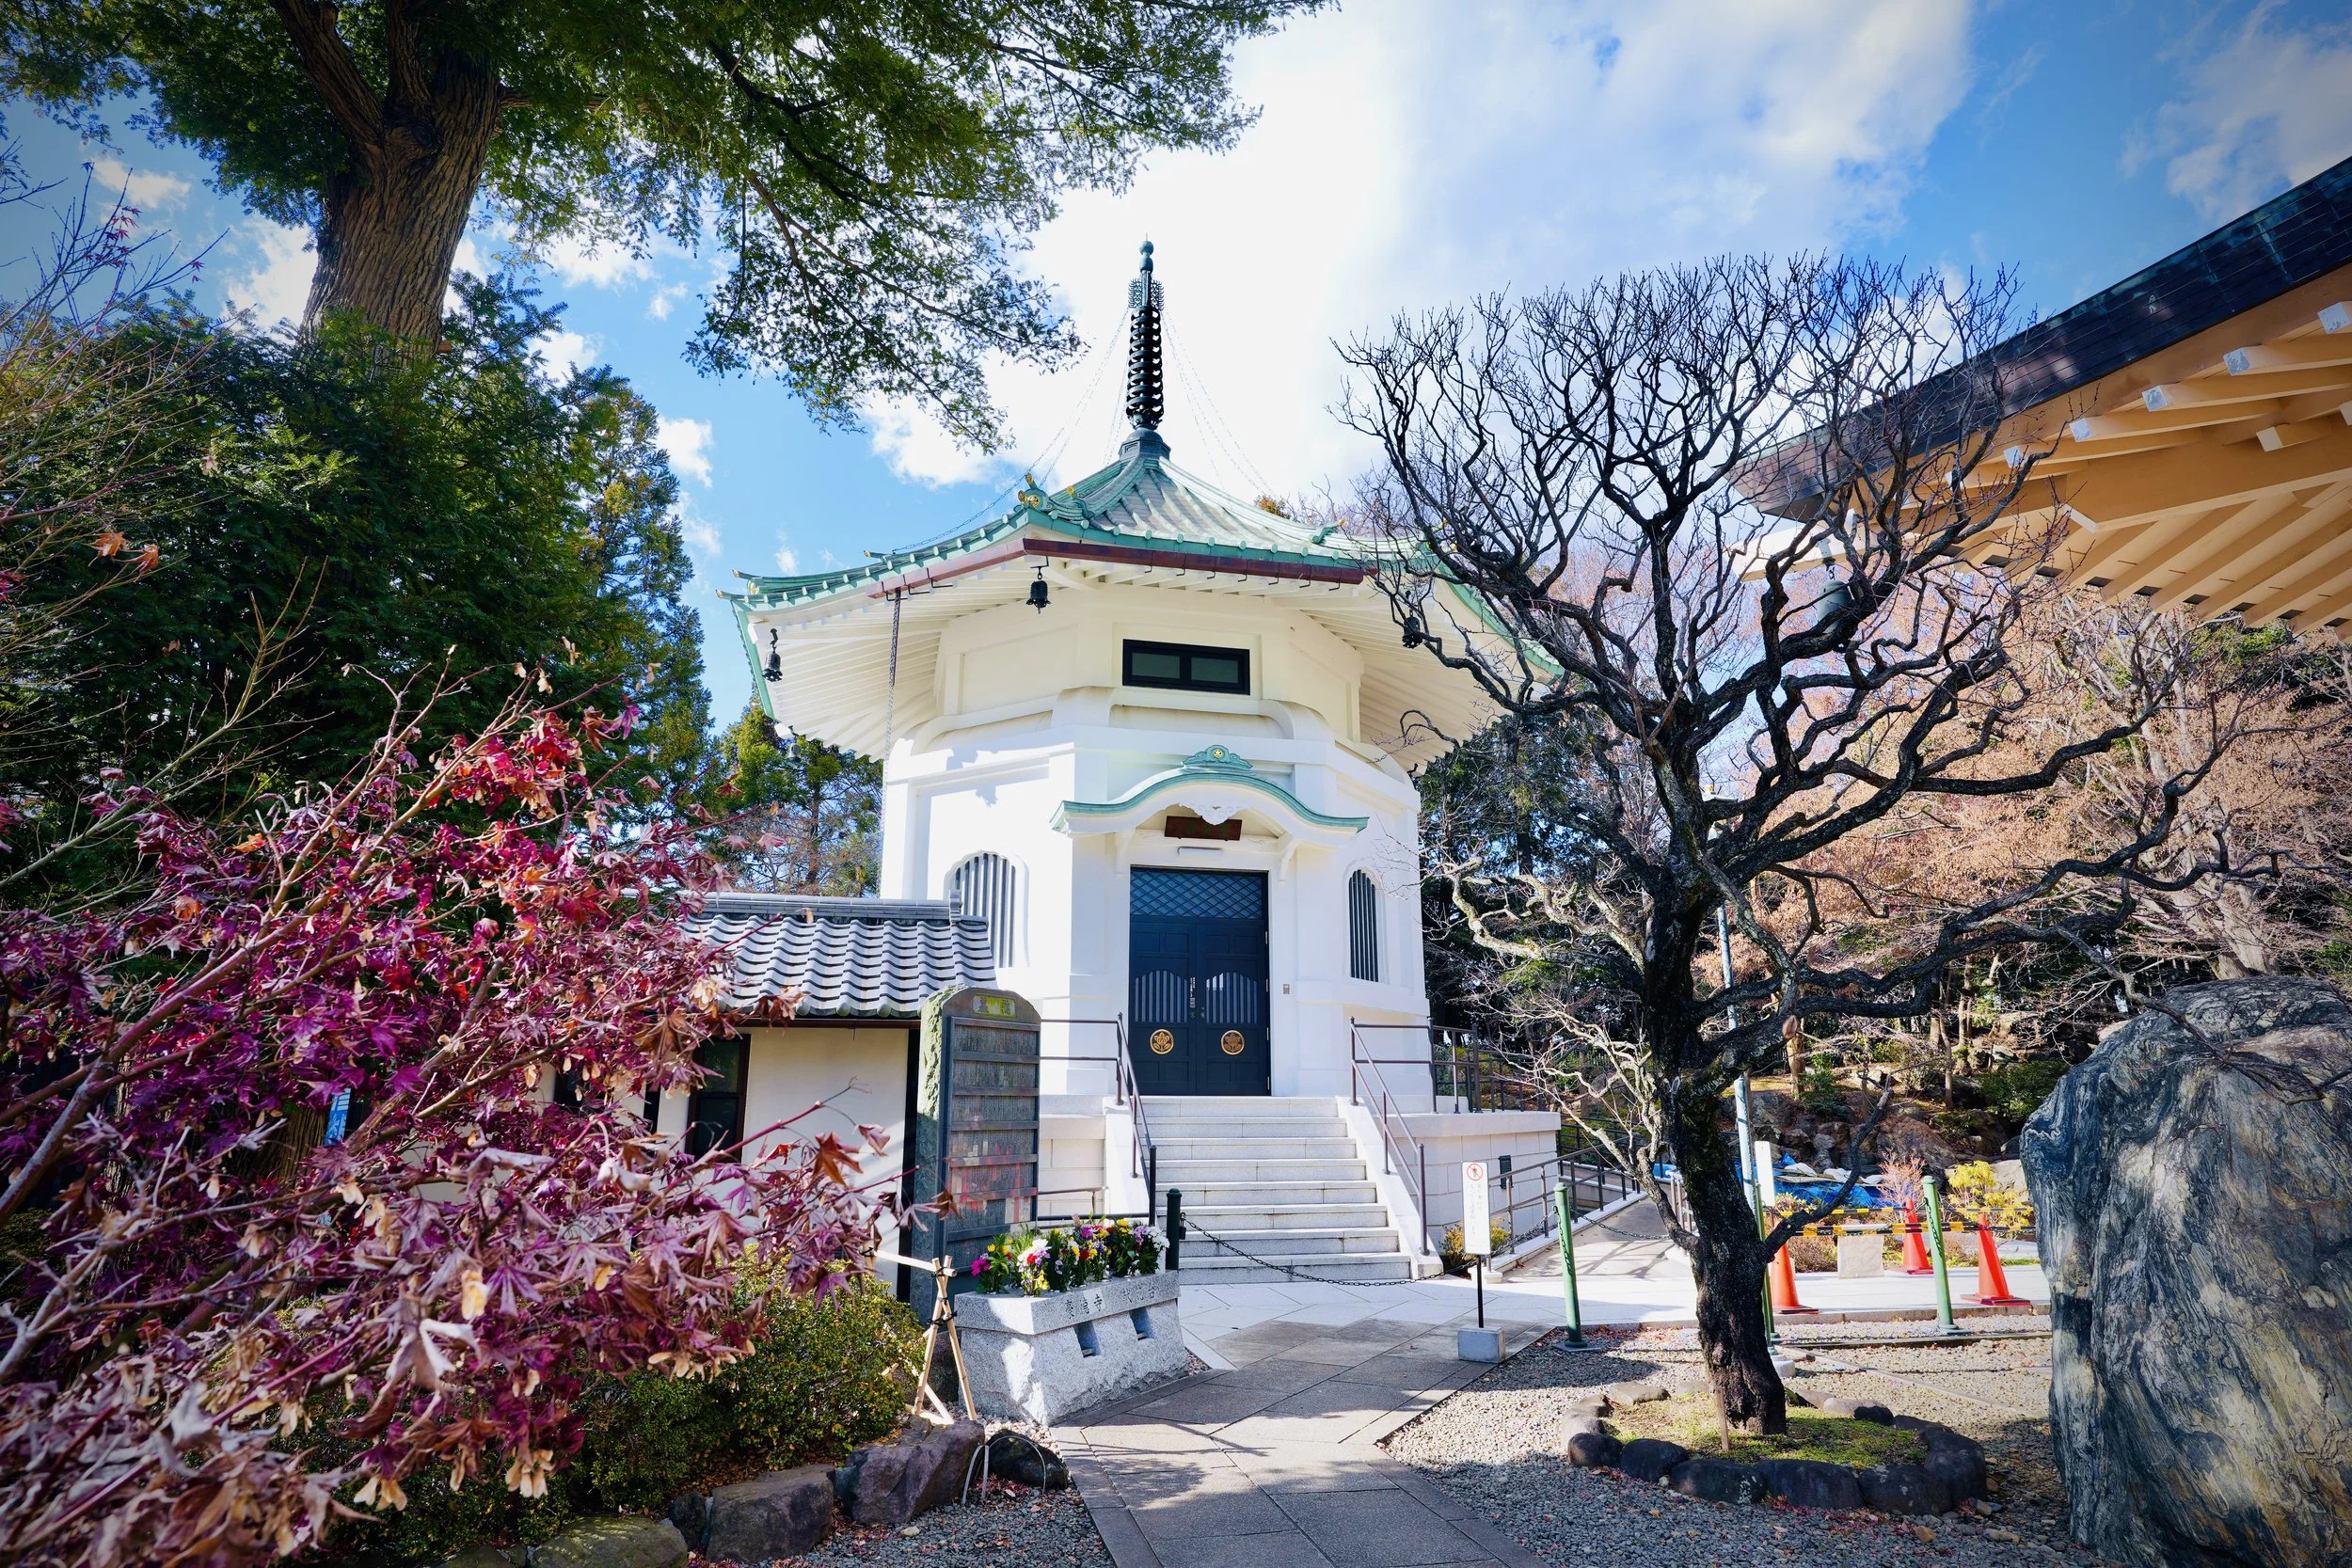
Bright, clean geometry—Tokyo’s modern clarity living beside older forms
Tokyo is famous for contrast, but it’s not chaotic contrast. It’s layered contrast. Neighborhoods and eras stacked together like a composite dataset—features from different time periods coexisting in the same row.
The city disappears behind foliage, like background processes you stop noticing
And that might be Tokyo’s most surprising statistic: not the population, not the density, not the infrastructure. It’s that in the middle of so much signal, you can still find places that refuse to compete. Places that don’t need to be loud to be real.
Tokyo teaches you scale. But these temples teach you resolution—the truth that meaning often lives in the smallest units: one plaque, one cat, one step on stone, one quiet breath in a city that never truly stops moving.
To see more photos & videos from my travels visit the links below
happy traveling,
~Sean