Tokyo After Dark: A City Measured in Light
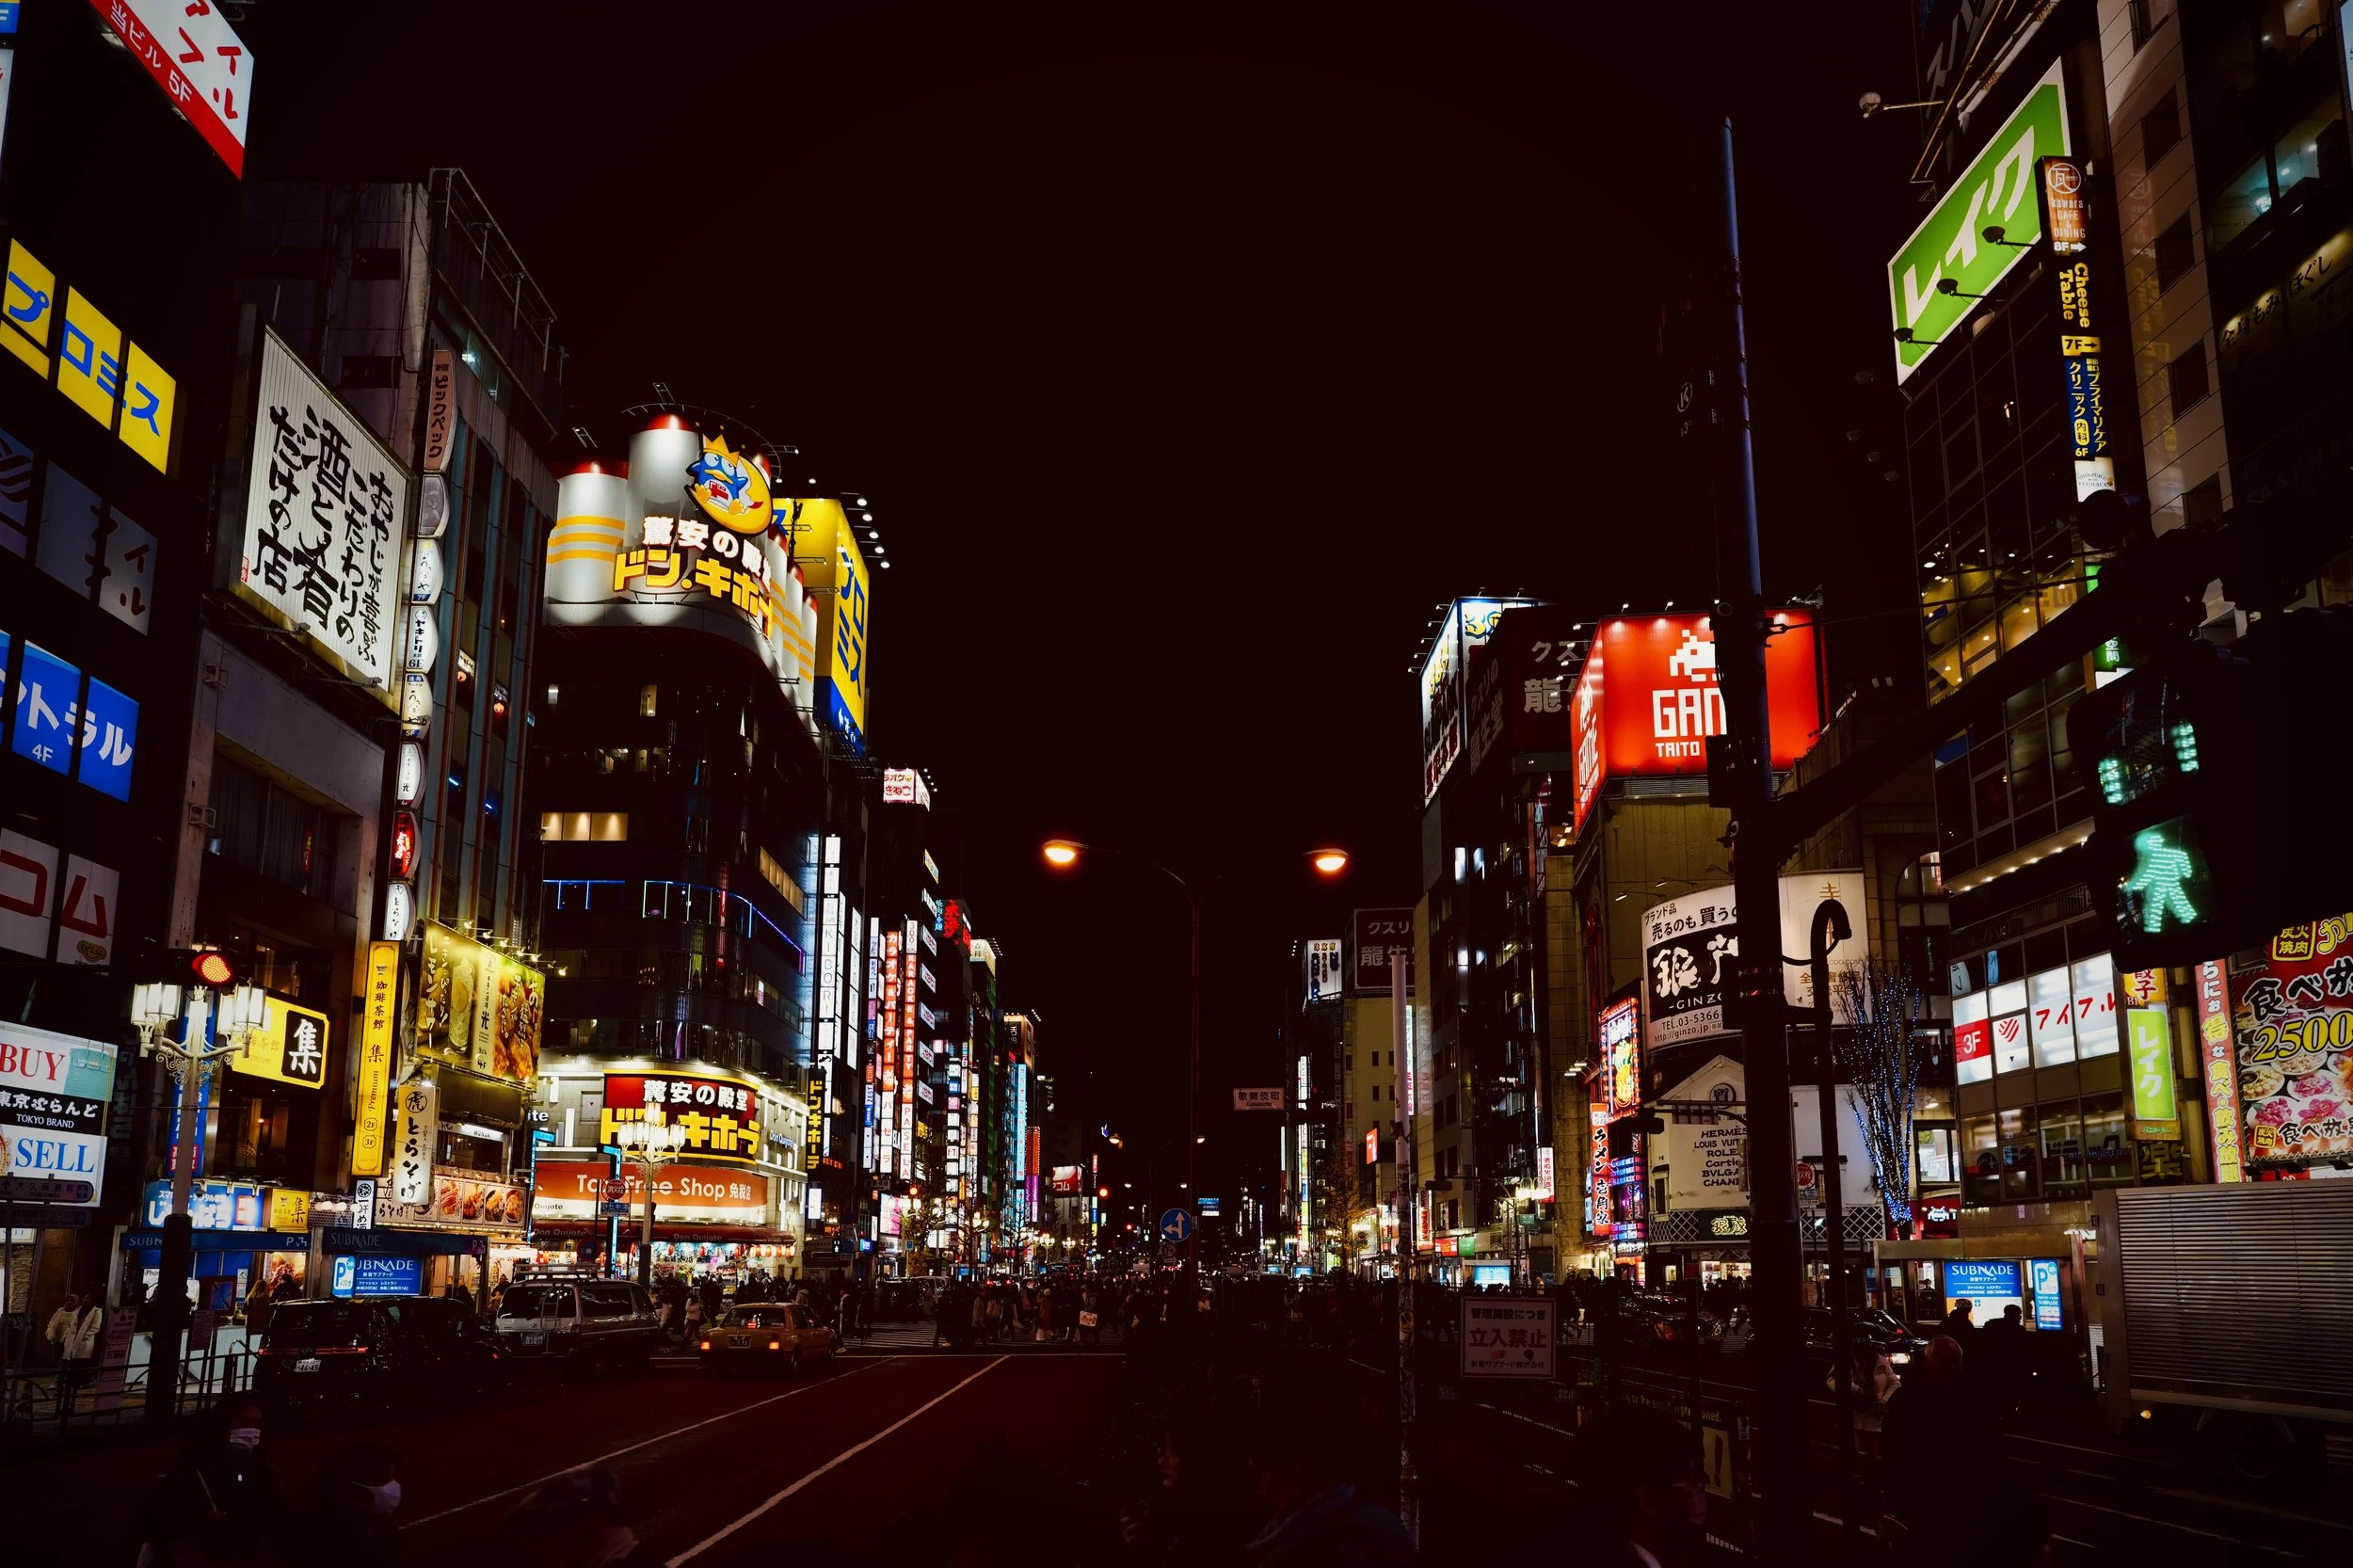
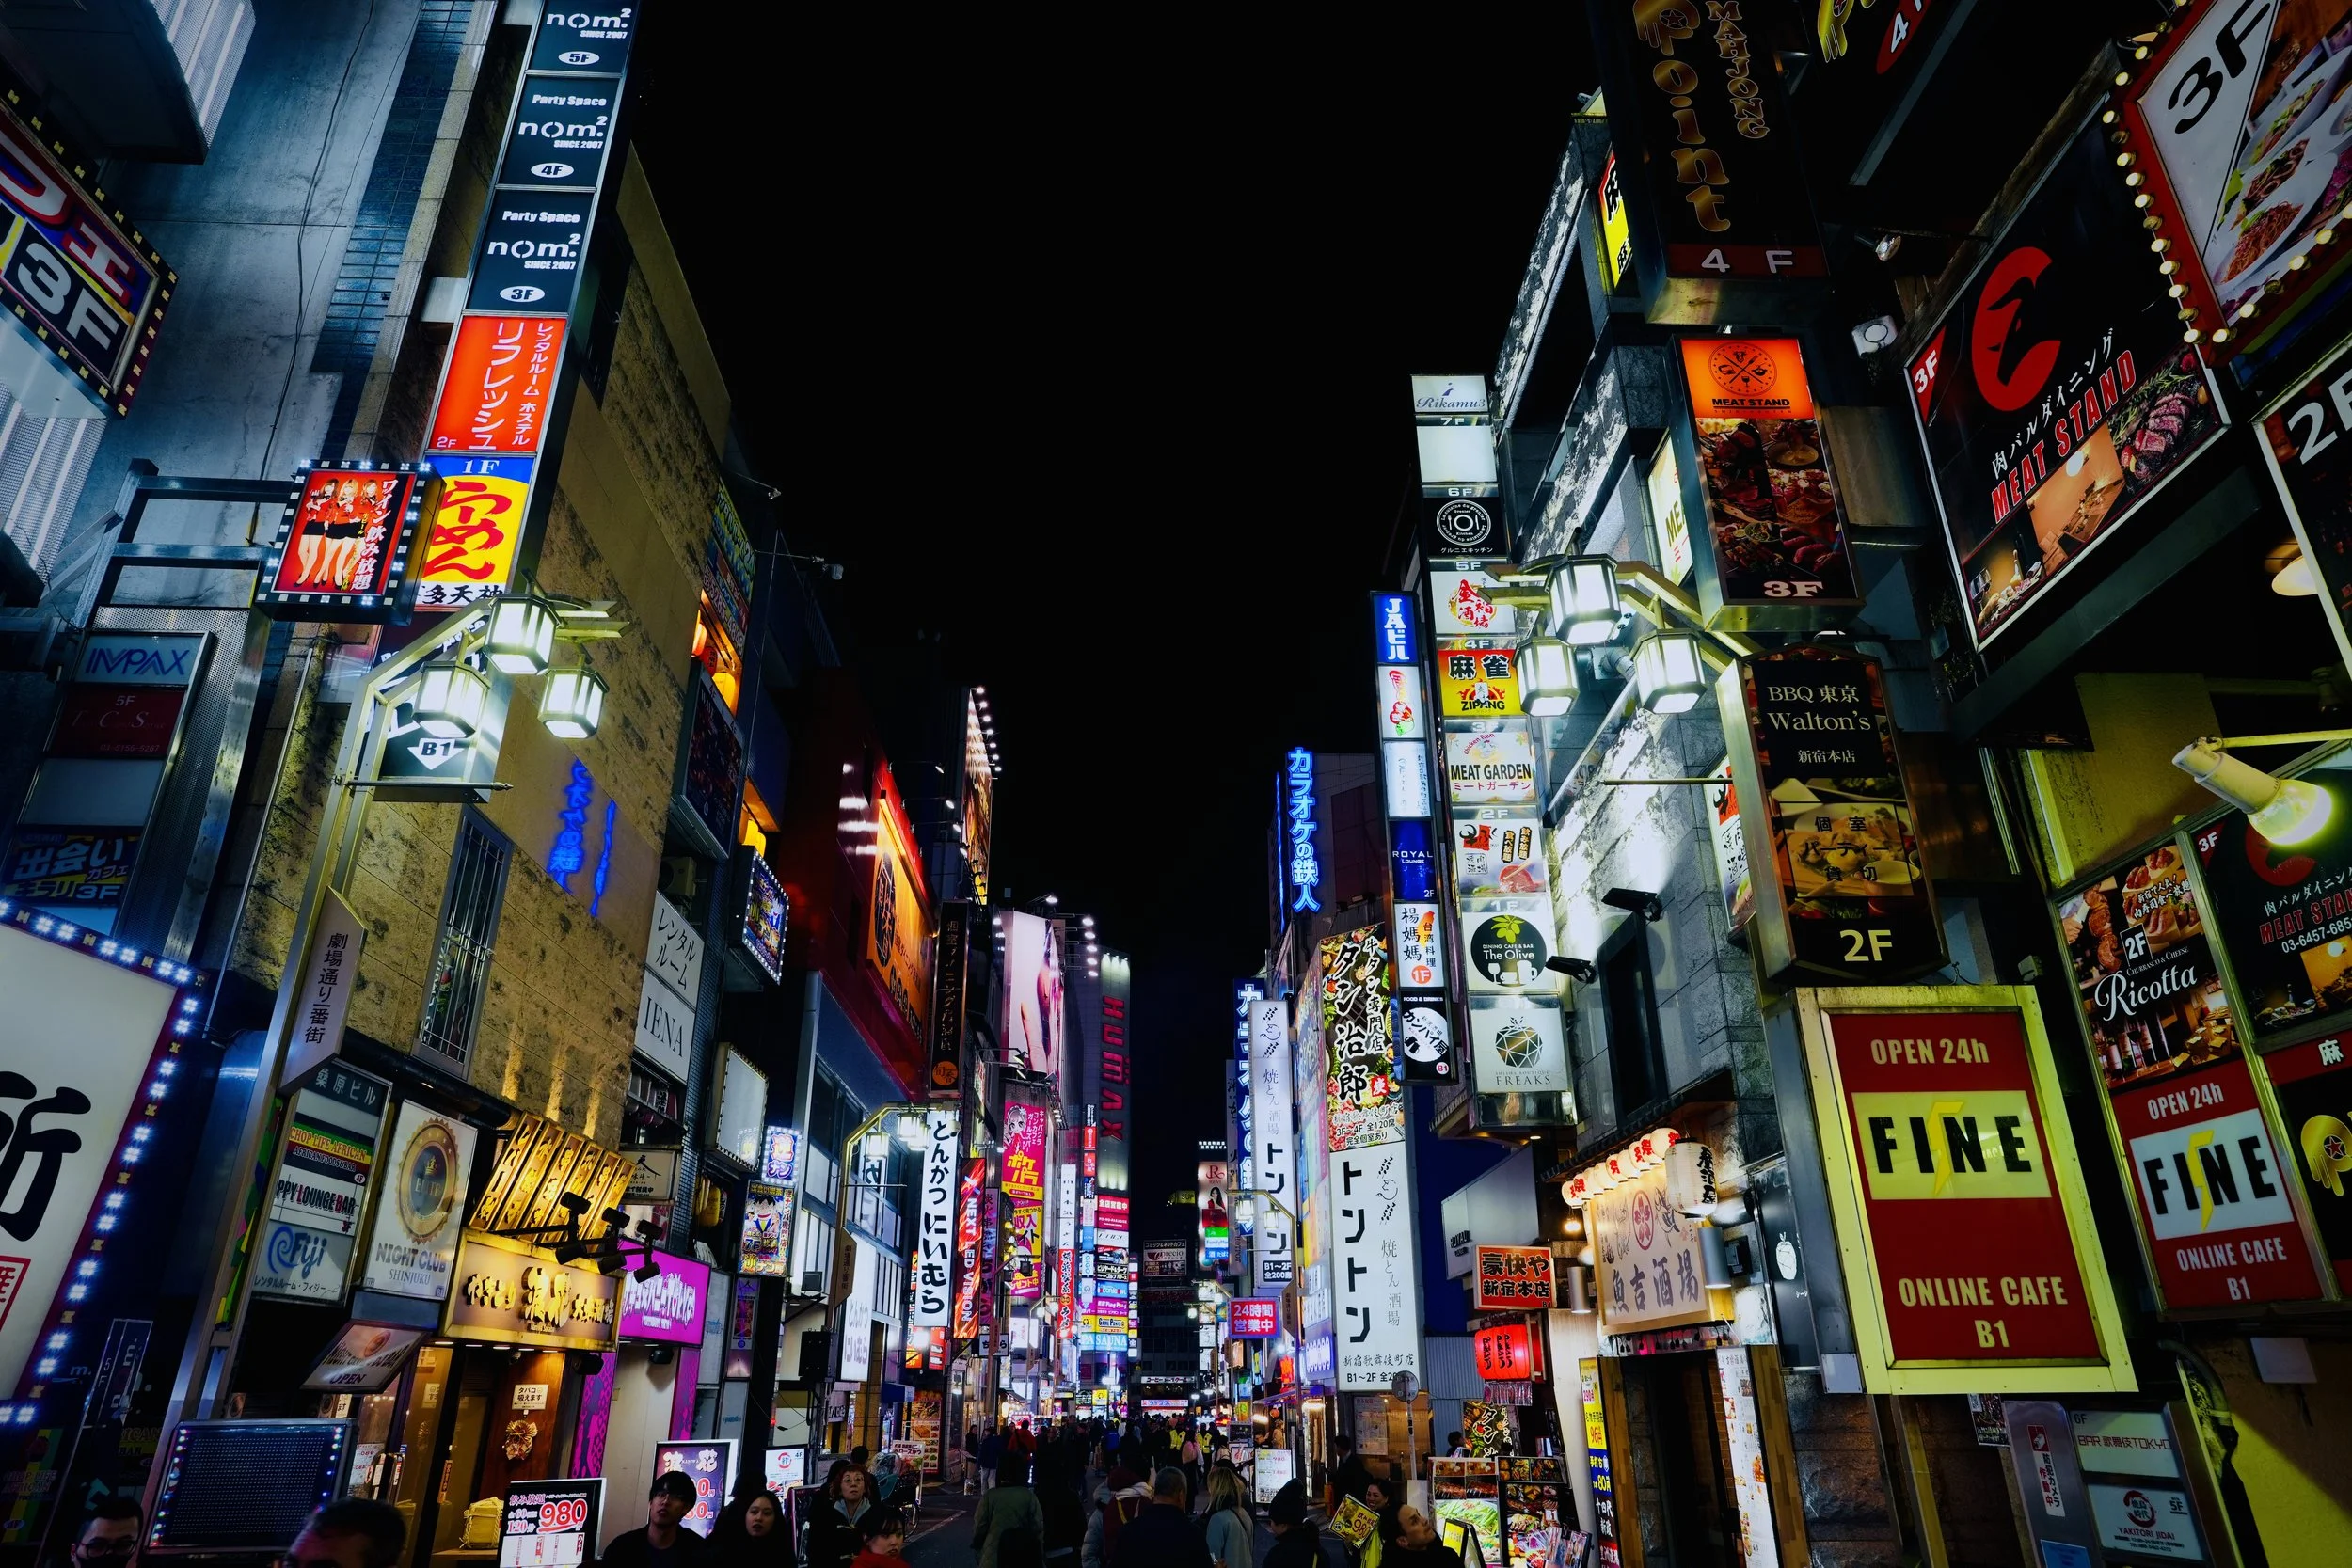
The first impression: light layered on light, stacked vertically into the Tokyo sky
Tokyo at night does not simply glow — it operates. The light is structural. Neon is not decoration here; it is infrastructure. Buildings rise like illuminated spreadsheets, each column a vertical dataset of restaurants, bars, arcades, clinics, karaoke rooms. If you stand still long enough, you realize the city behaves less like a neighborhood and more like a live dashboard — constantly updating, constantly recalculating.
And this isn’t just one district. It’s Shinjuku. It’s Nakano. It’s backstreets in Shibuya. It’s wherever the train doors open and the sun has already gone down.
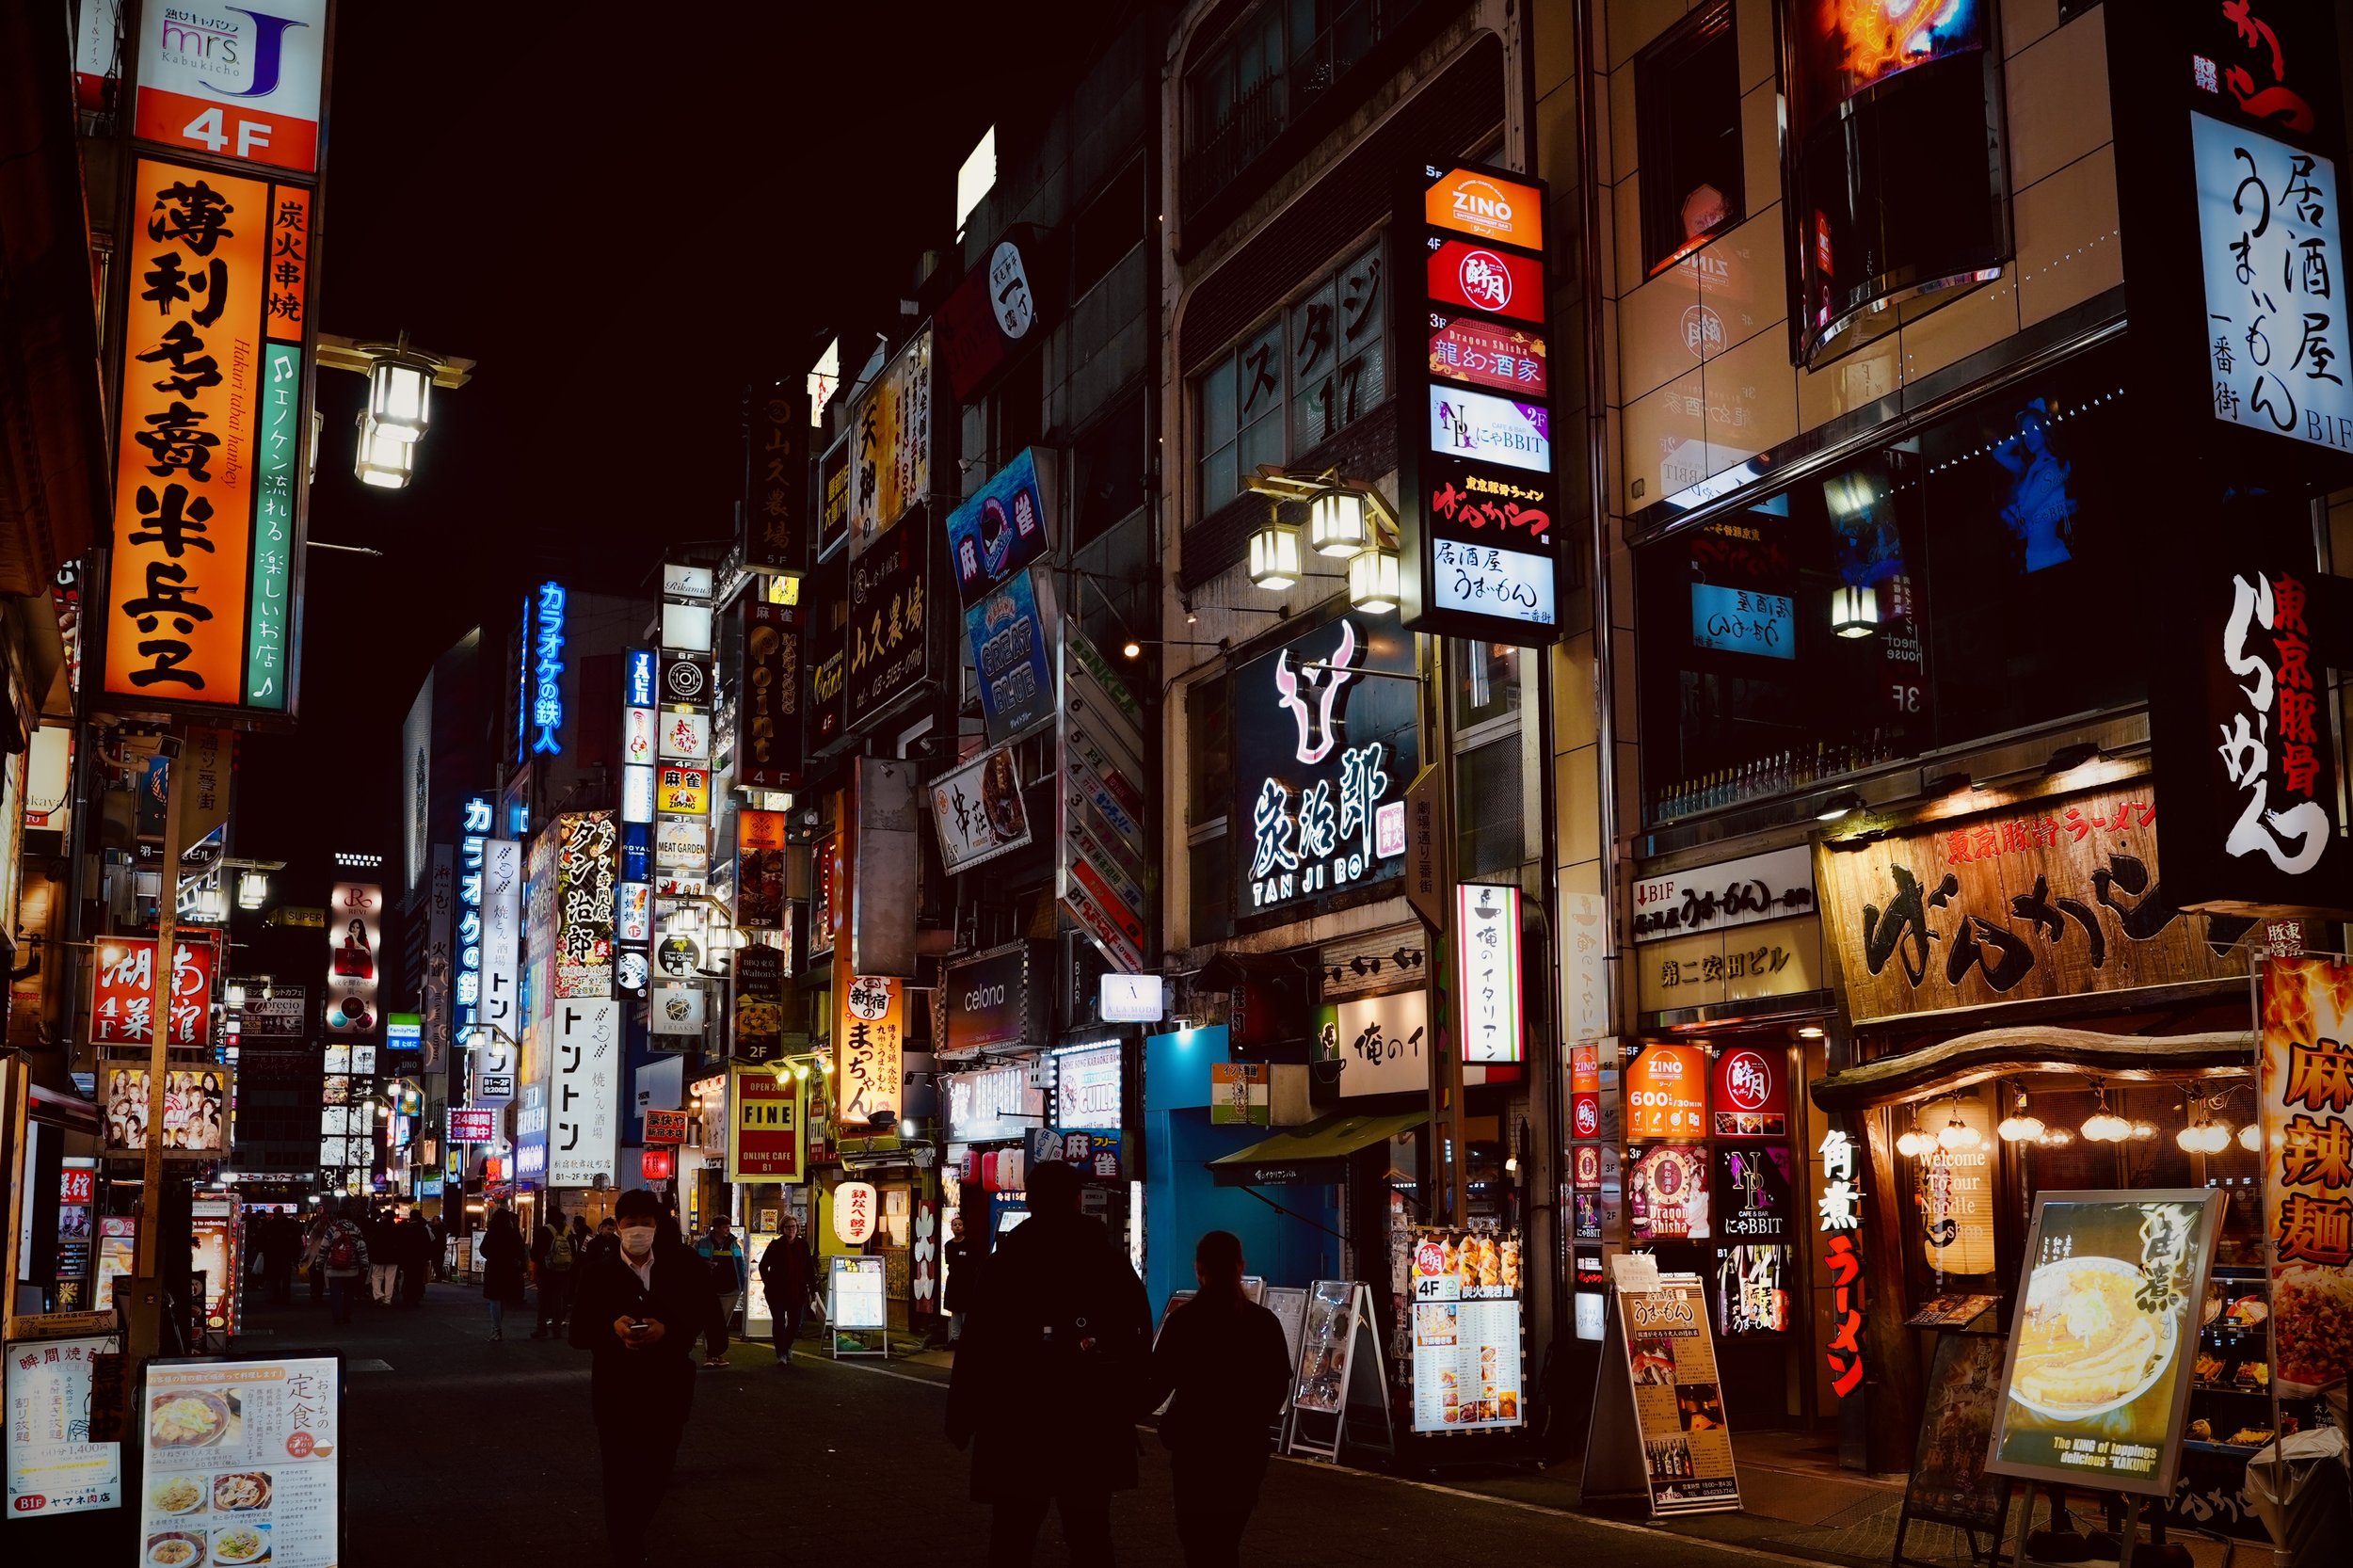
Where advertising becomes architecture
There are few places on Earth where commercial density feels this concentrated. Signage stacks from street level to rooftop, competing for attention in layers. From a data perspective, it’s spatial optimization in its purest form. When horizontal expansion is limited, value grows vertically. Tokyo’s skyline isn’t just tall; it’s monetized.
Yet walking through it doesn’t feel analytical. It feels electric. The human brain can’t fully process every color, every character, every signal. Saturation creates immersion.
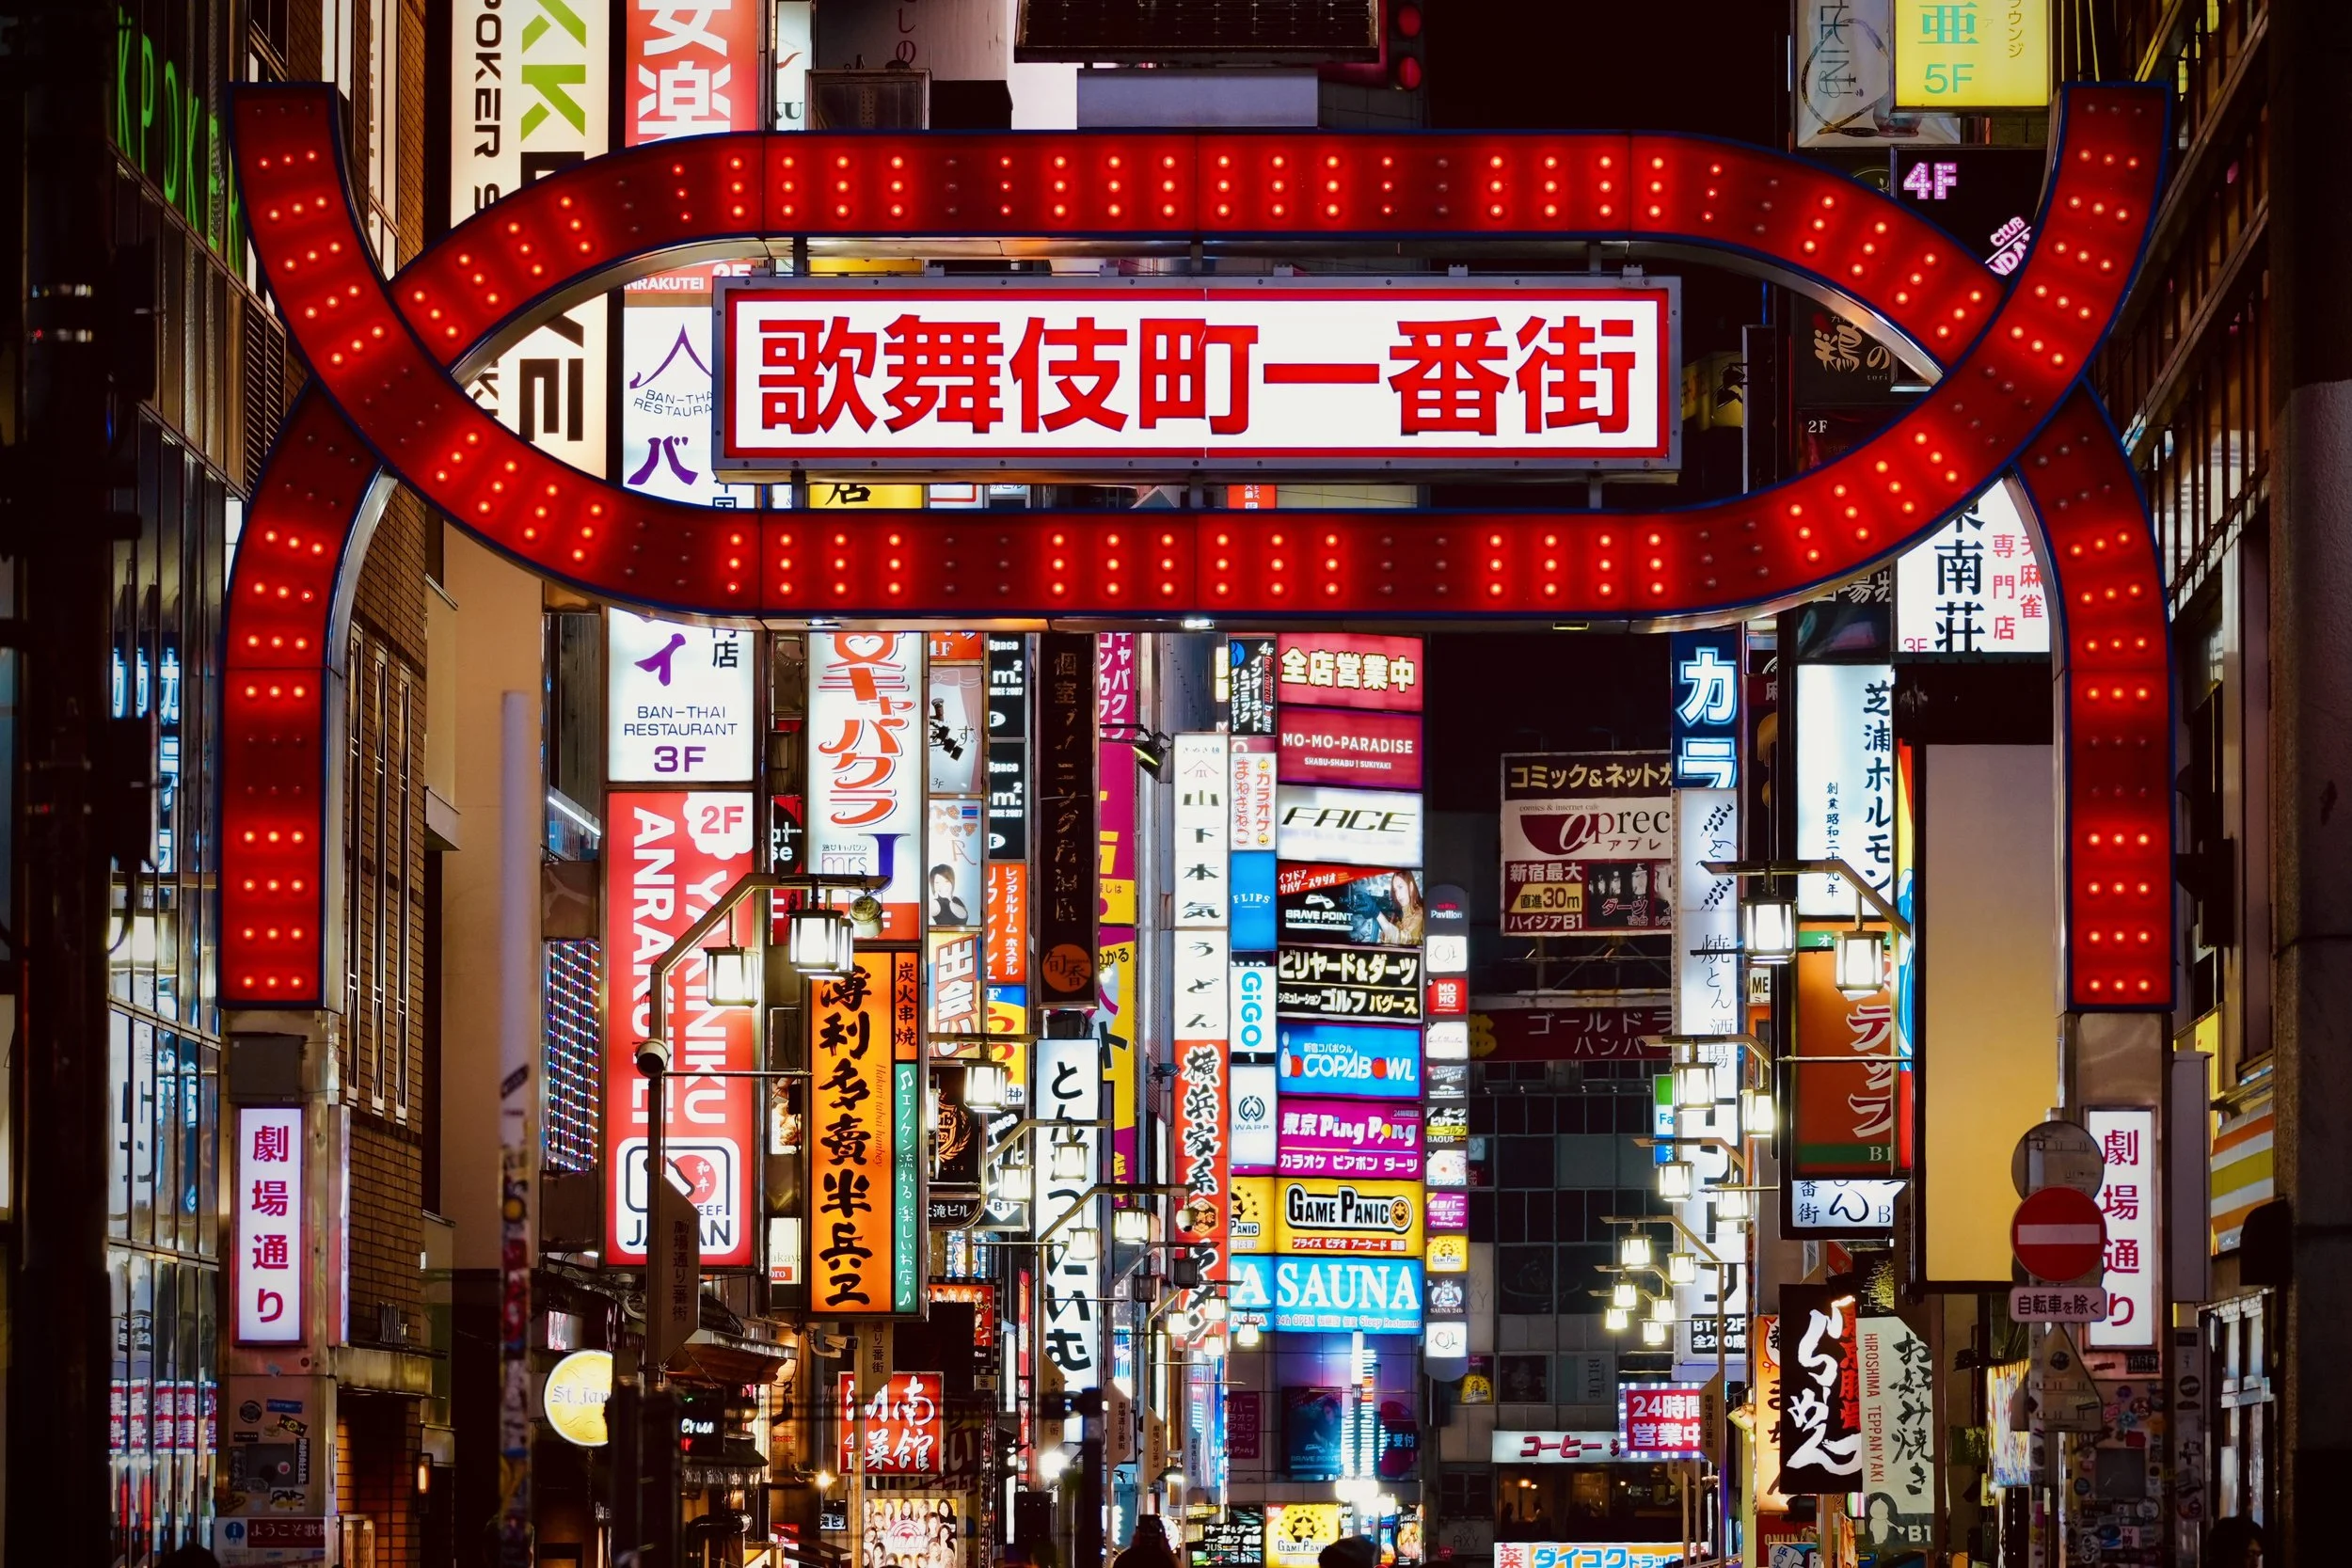
An entry point into Tokyo’s nighttime economy
In districts like Kabukicho, the red gates act as thresholds. You cross beneath them and the variables shift. Restaurants multiply. Bars compress into narrow stairwells. Arcades pulse with LED light. Tokyo’s metropolitan population exceeds 37 million. After dark, that mass redistributes into pockets of intensity like this.
The system scales — but it doesn’t collapse.
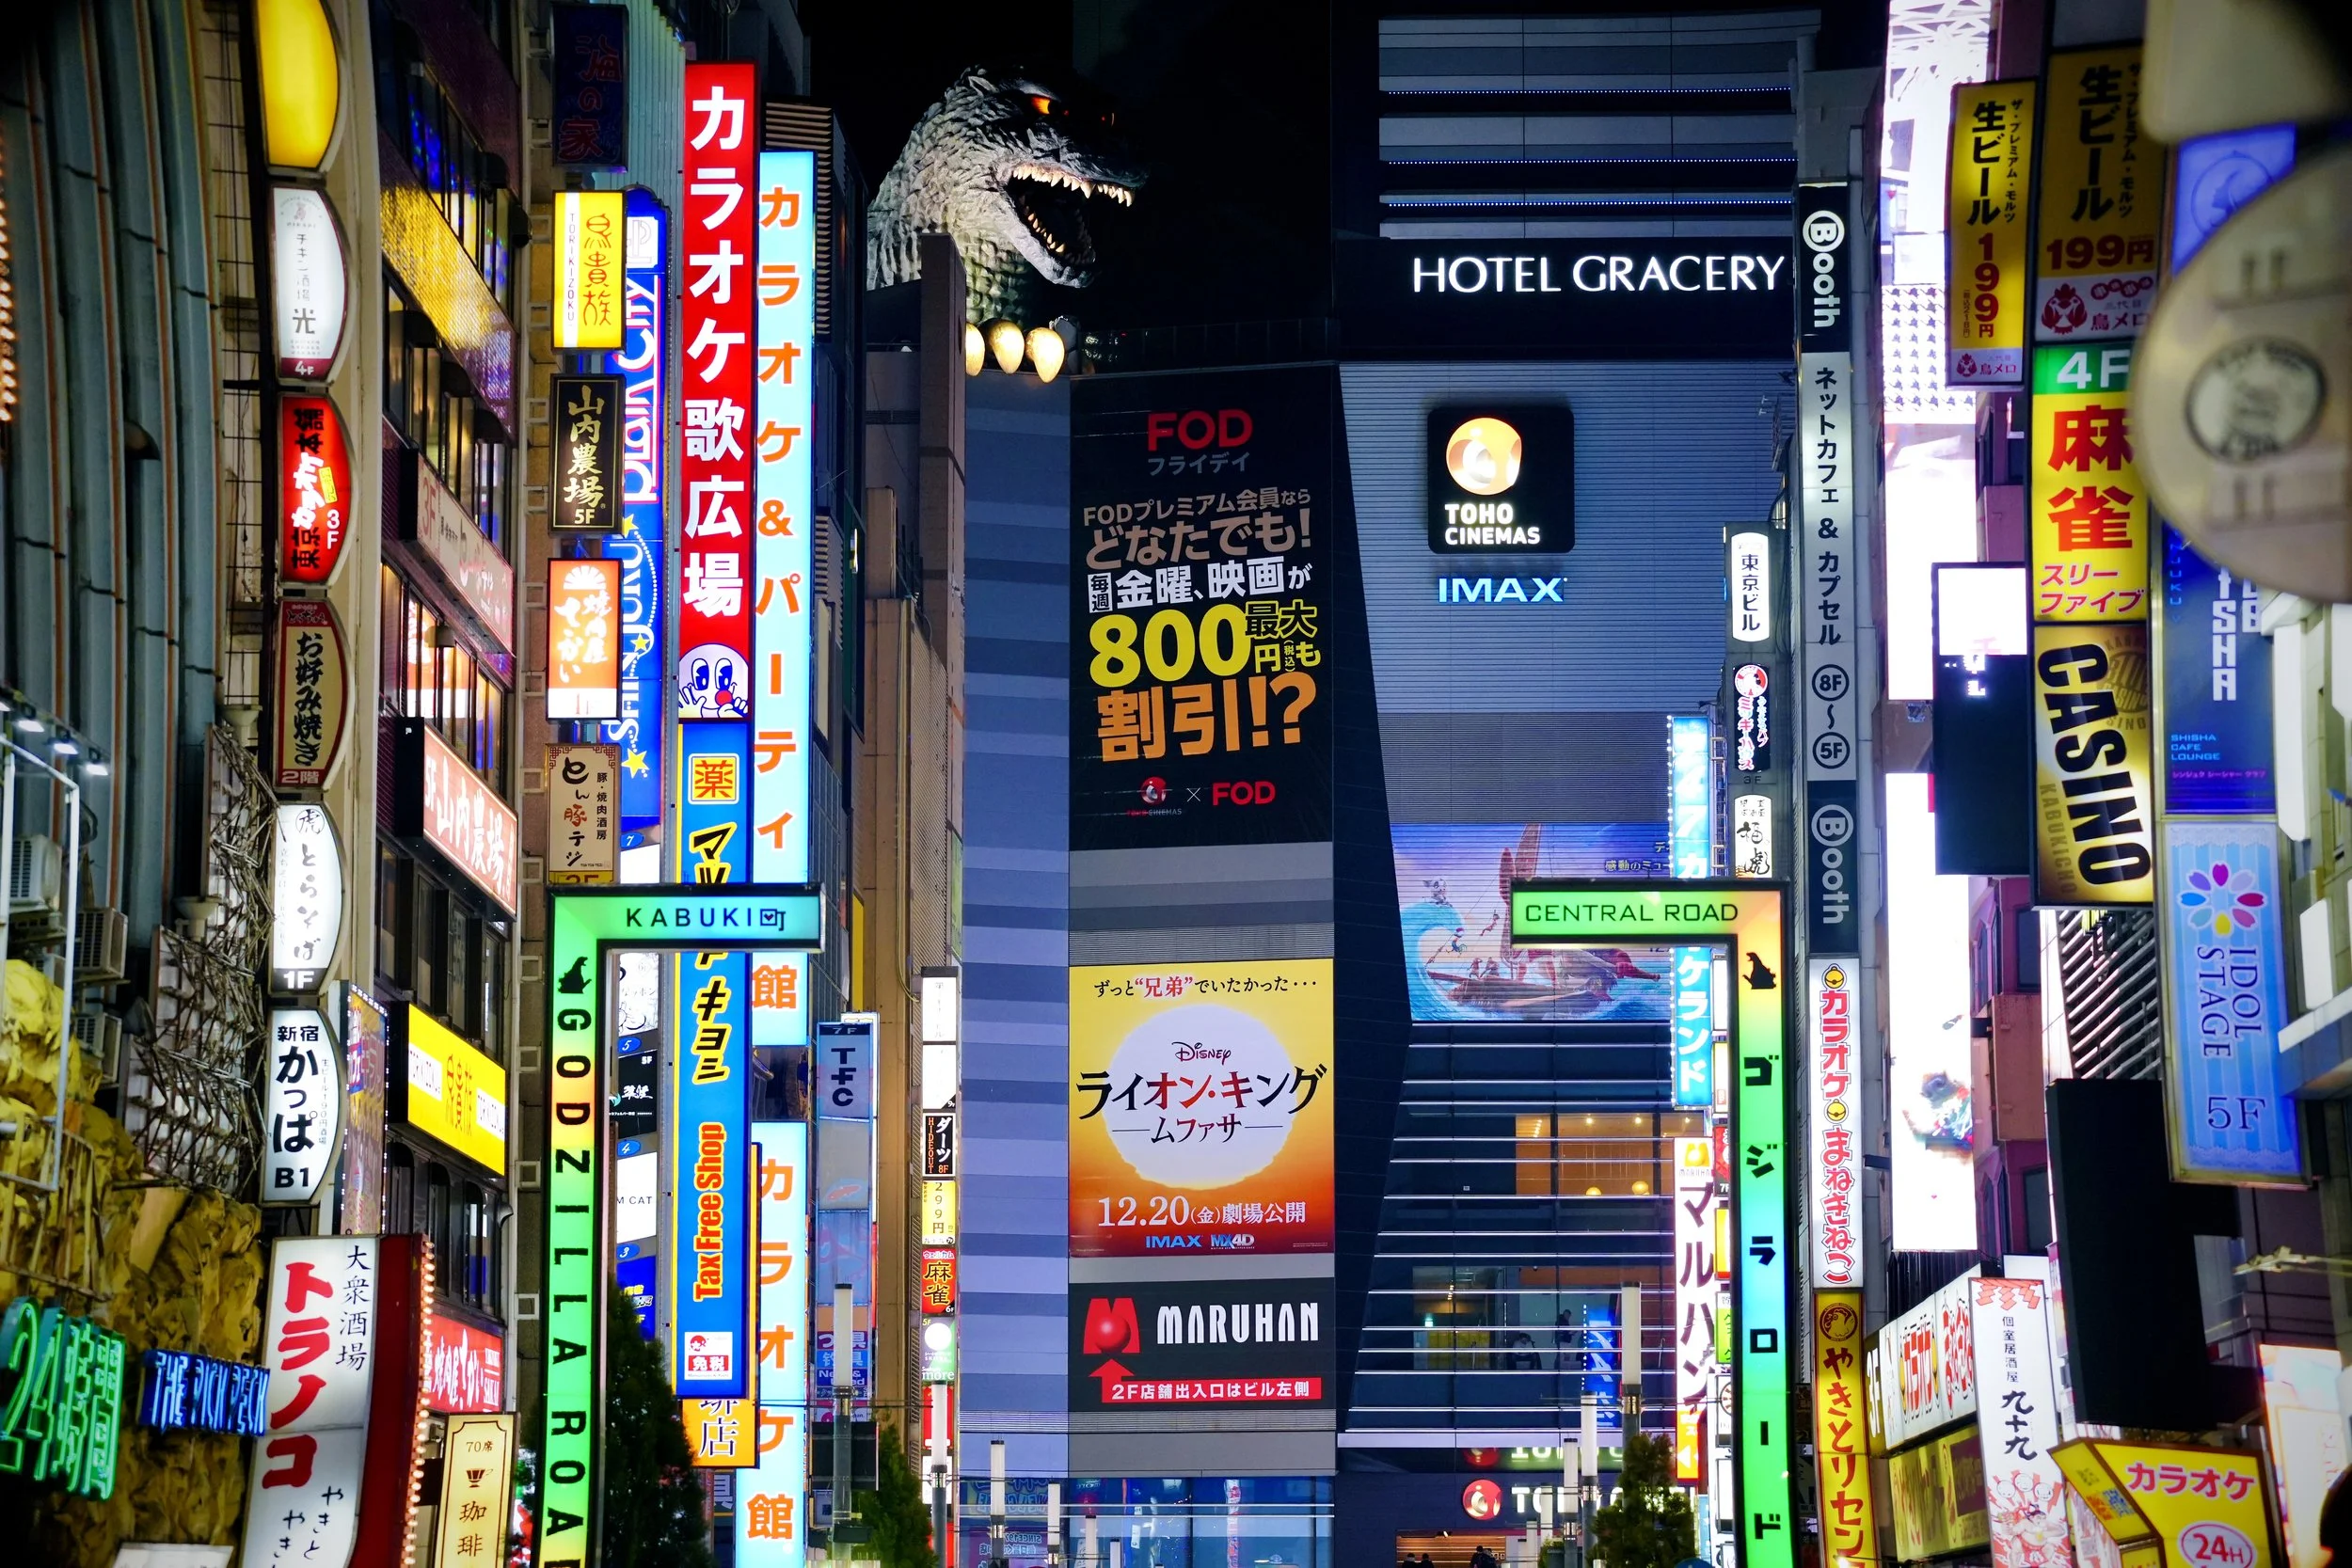
Cinema meets skyline
The Godzilla head perched above a hotel feels symbolic. A fictional monster watches over one of the safest megacities in the world. Tokyo consistently ranks among the safest global cities relative to its size. Scale without chaos. Density without disorder.
From a data science lens, that’s anomaly reduction at metropolitan scale.
The vertical economy
Whether in Shinjuku or other commercial hubs, Tokyo builds upward. Narrow plots of land generate multi-story ecosystems. One building might contain a ramen shop, a karaoke lounge, a dentist’s office, and a gaming arcade — stacked in layers like variables in a model.
Shinjuku Station alone handles more than three million passengers per day, the busiest in the world. That flow doesn’t disappear. It diffuses outward, feeding neighborhoods across the city.
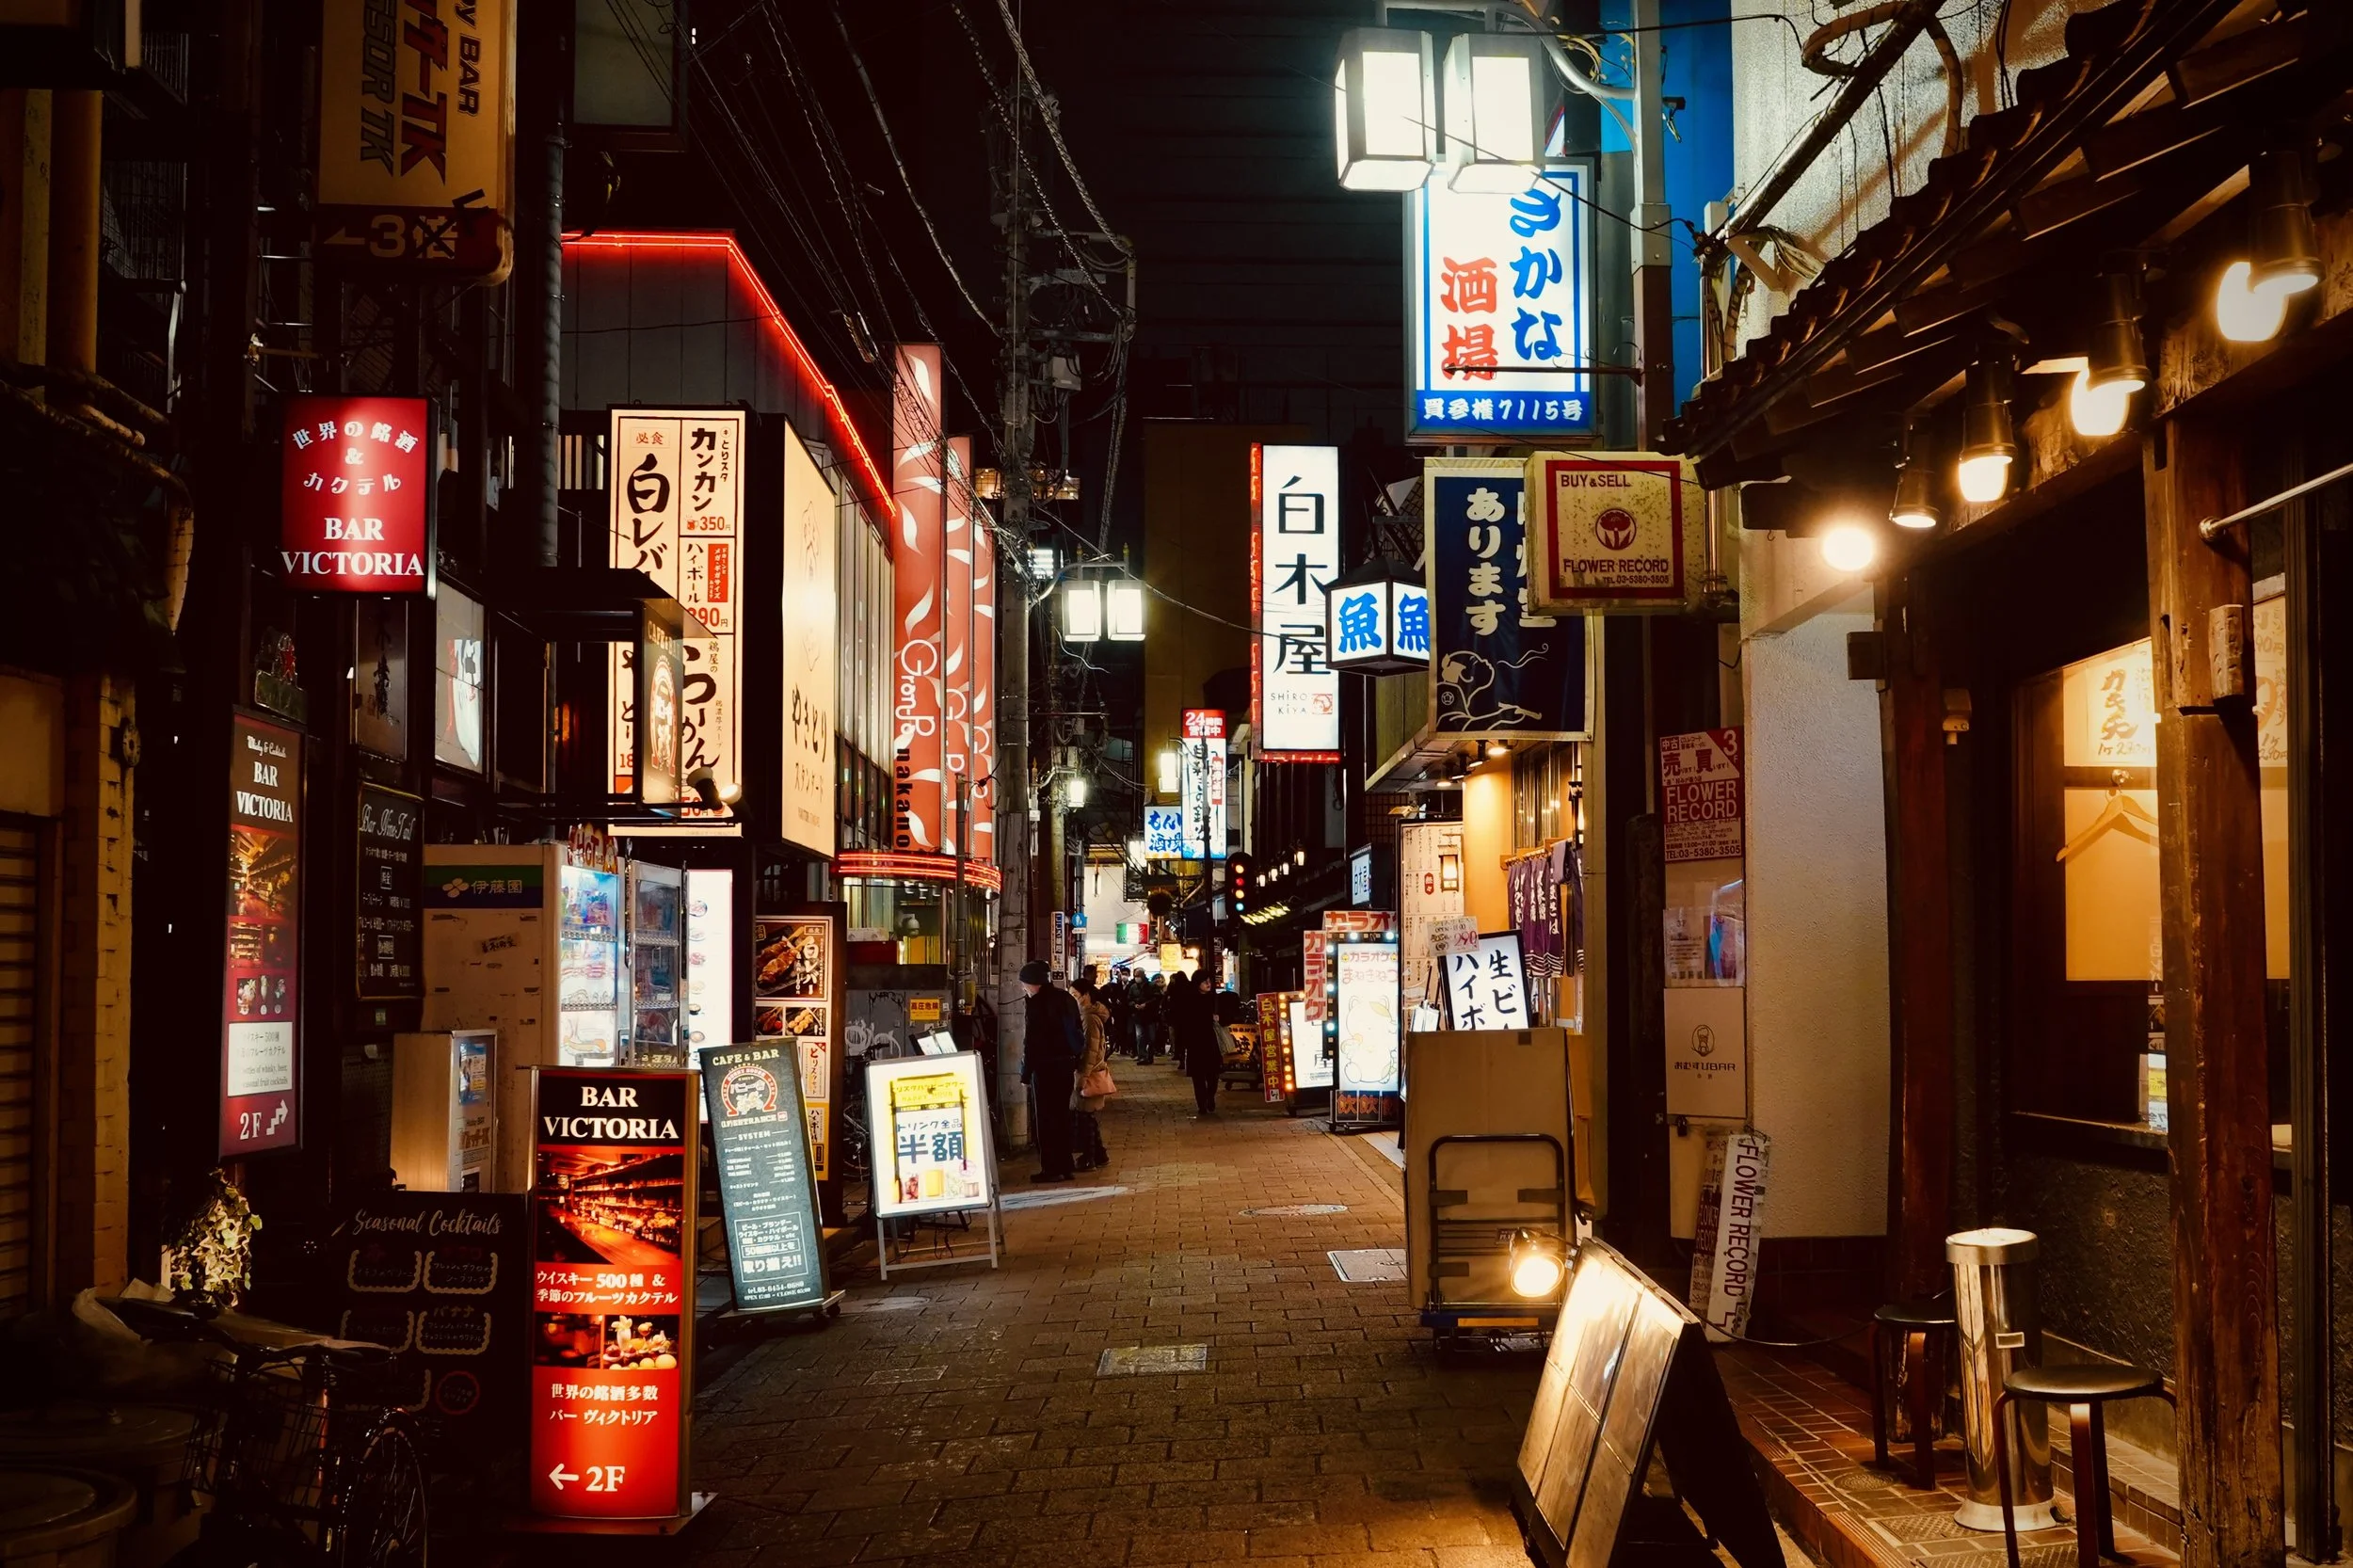
Scale shrinks. Intensity remains
Then the streets tighten. Neon gives way to lantern light. You step into alleys barely wide enough for two people to pass, and suddenly the dataset feels intimate. Eight seats at a counter. A single chef. Steam rising into cold night air.
Tokyo’s efficiency is often measured in transit times and land-use ratios. But here, efficiency feels human. Space is used fully, carefully, deliberately.
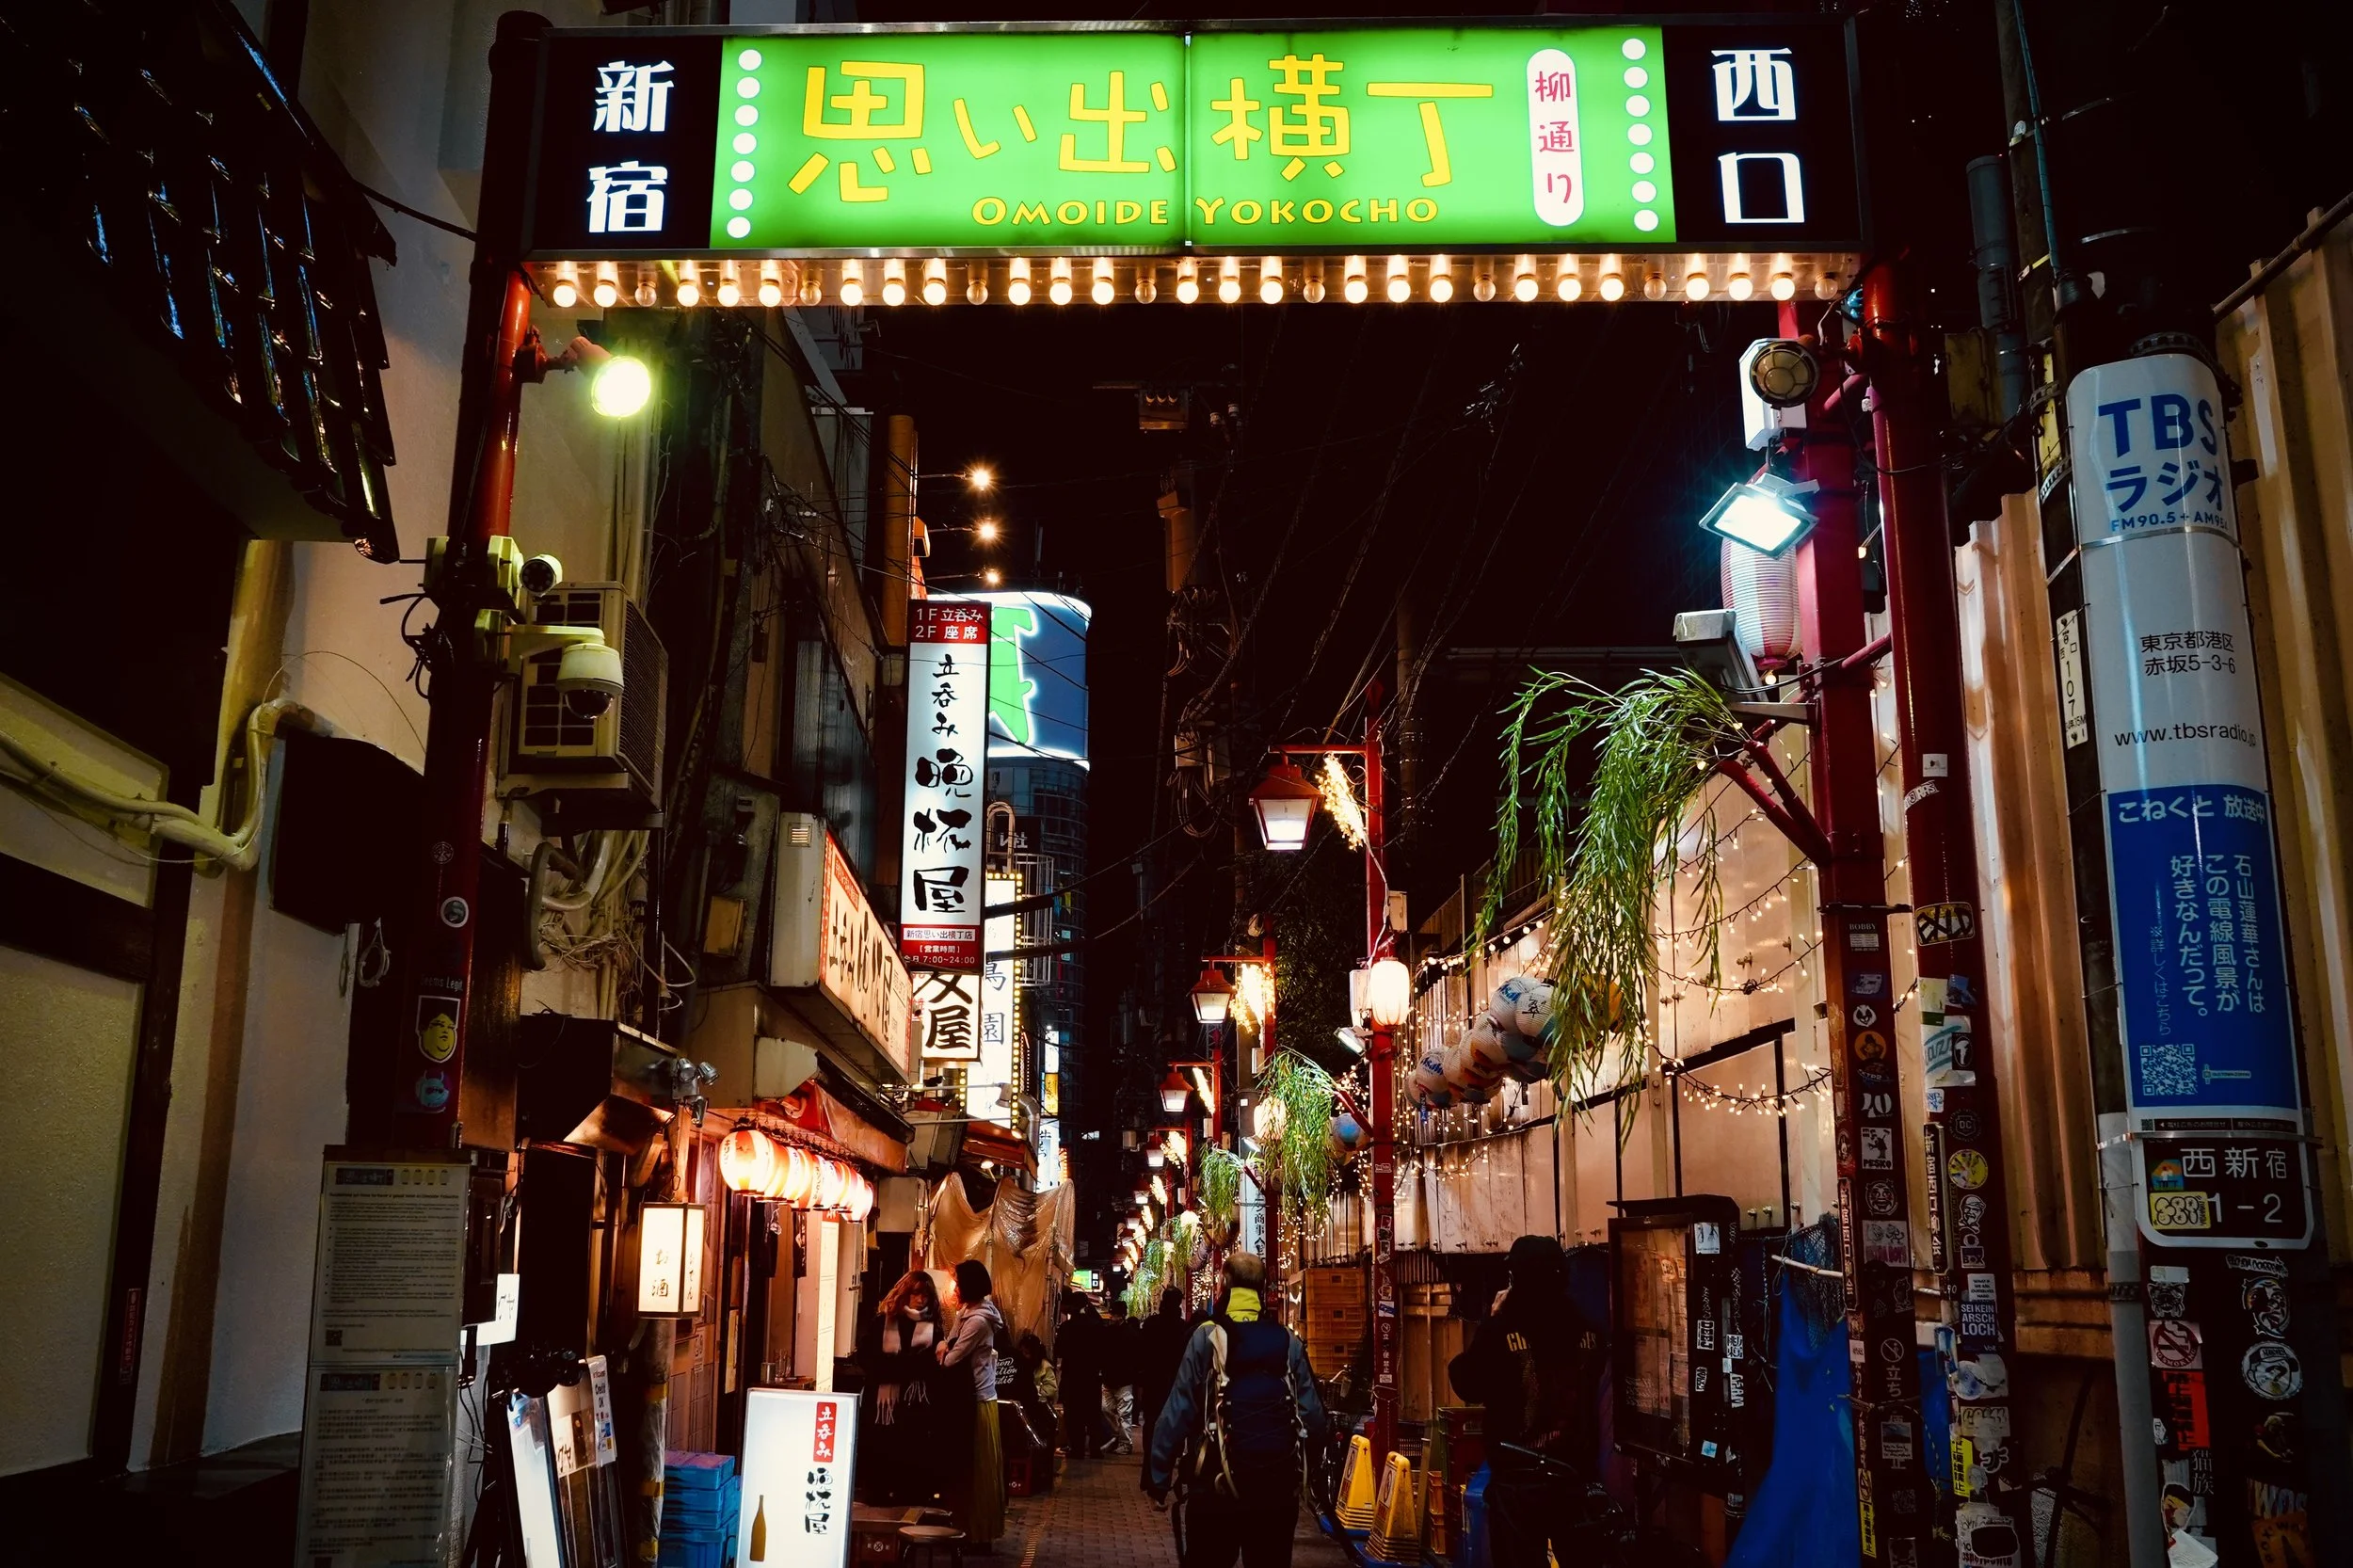
Memory preserved inside a megacity
Places like Omoide Yokocho feel like preserved residuals in an otherwise forward-driving regression line. Post-war alleyways remain stitched into modern Tokyo. Skyscrapers rise nearby, but these corridors persist.
Preservation is a decision. So is redevelopment. Tokyo holds both in tension.
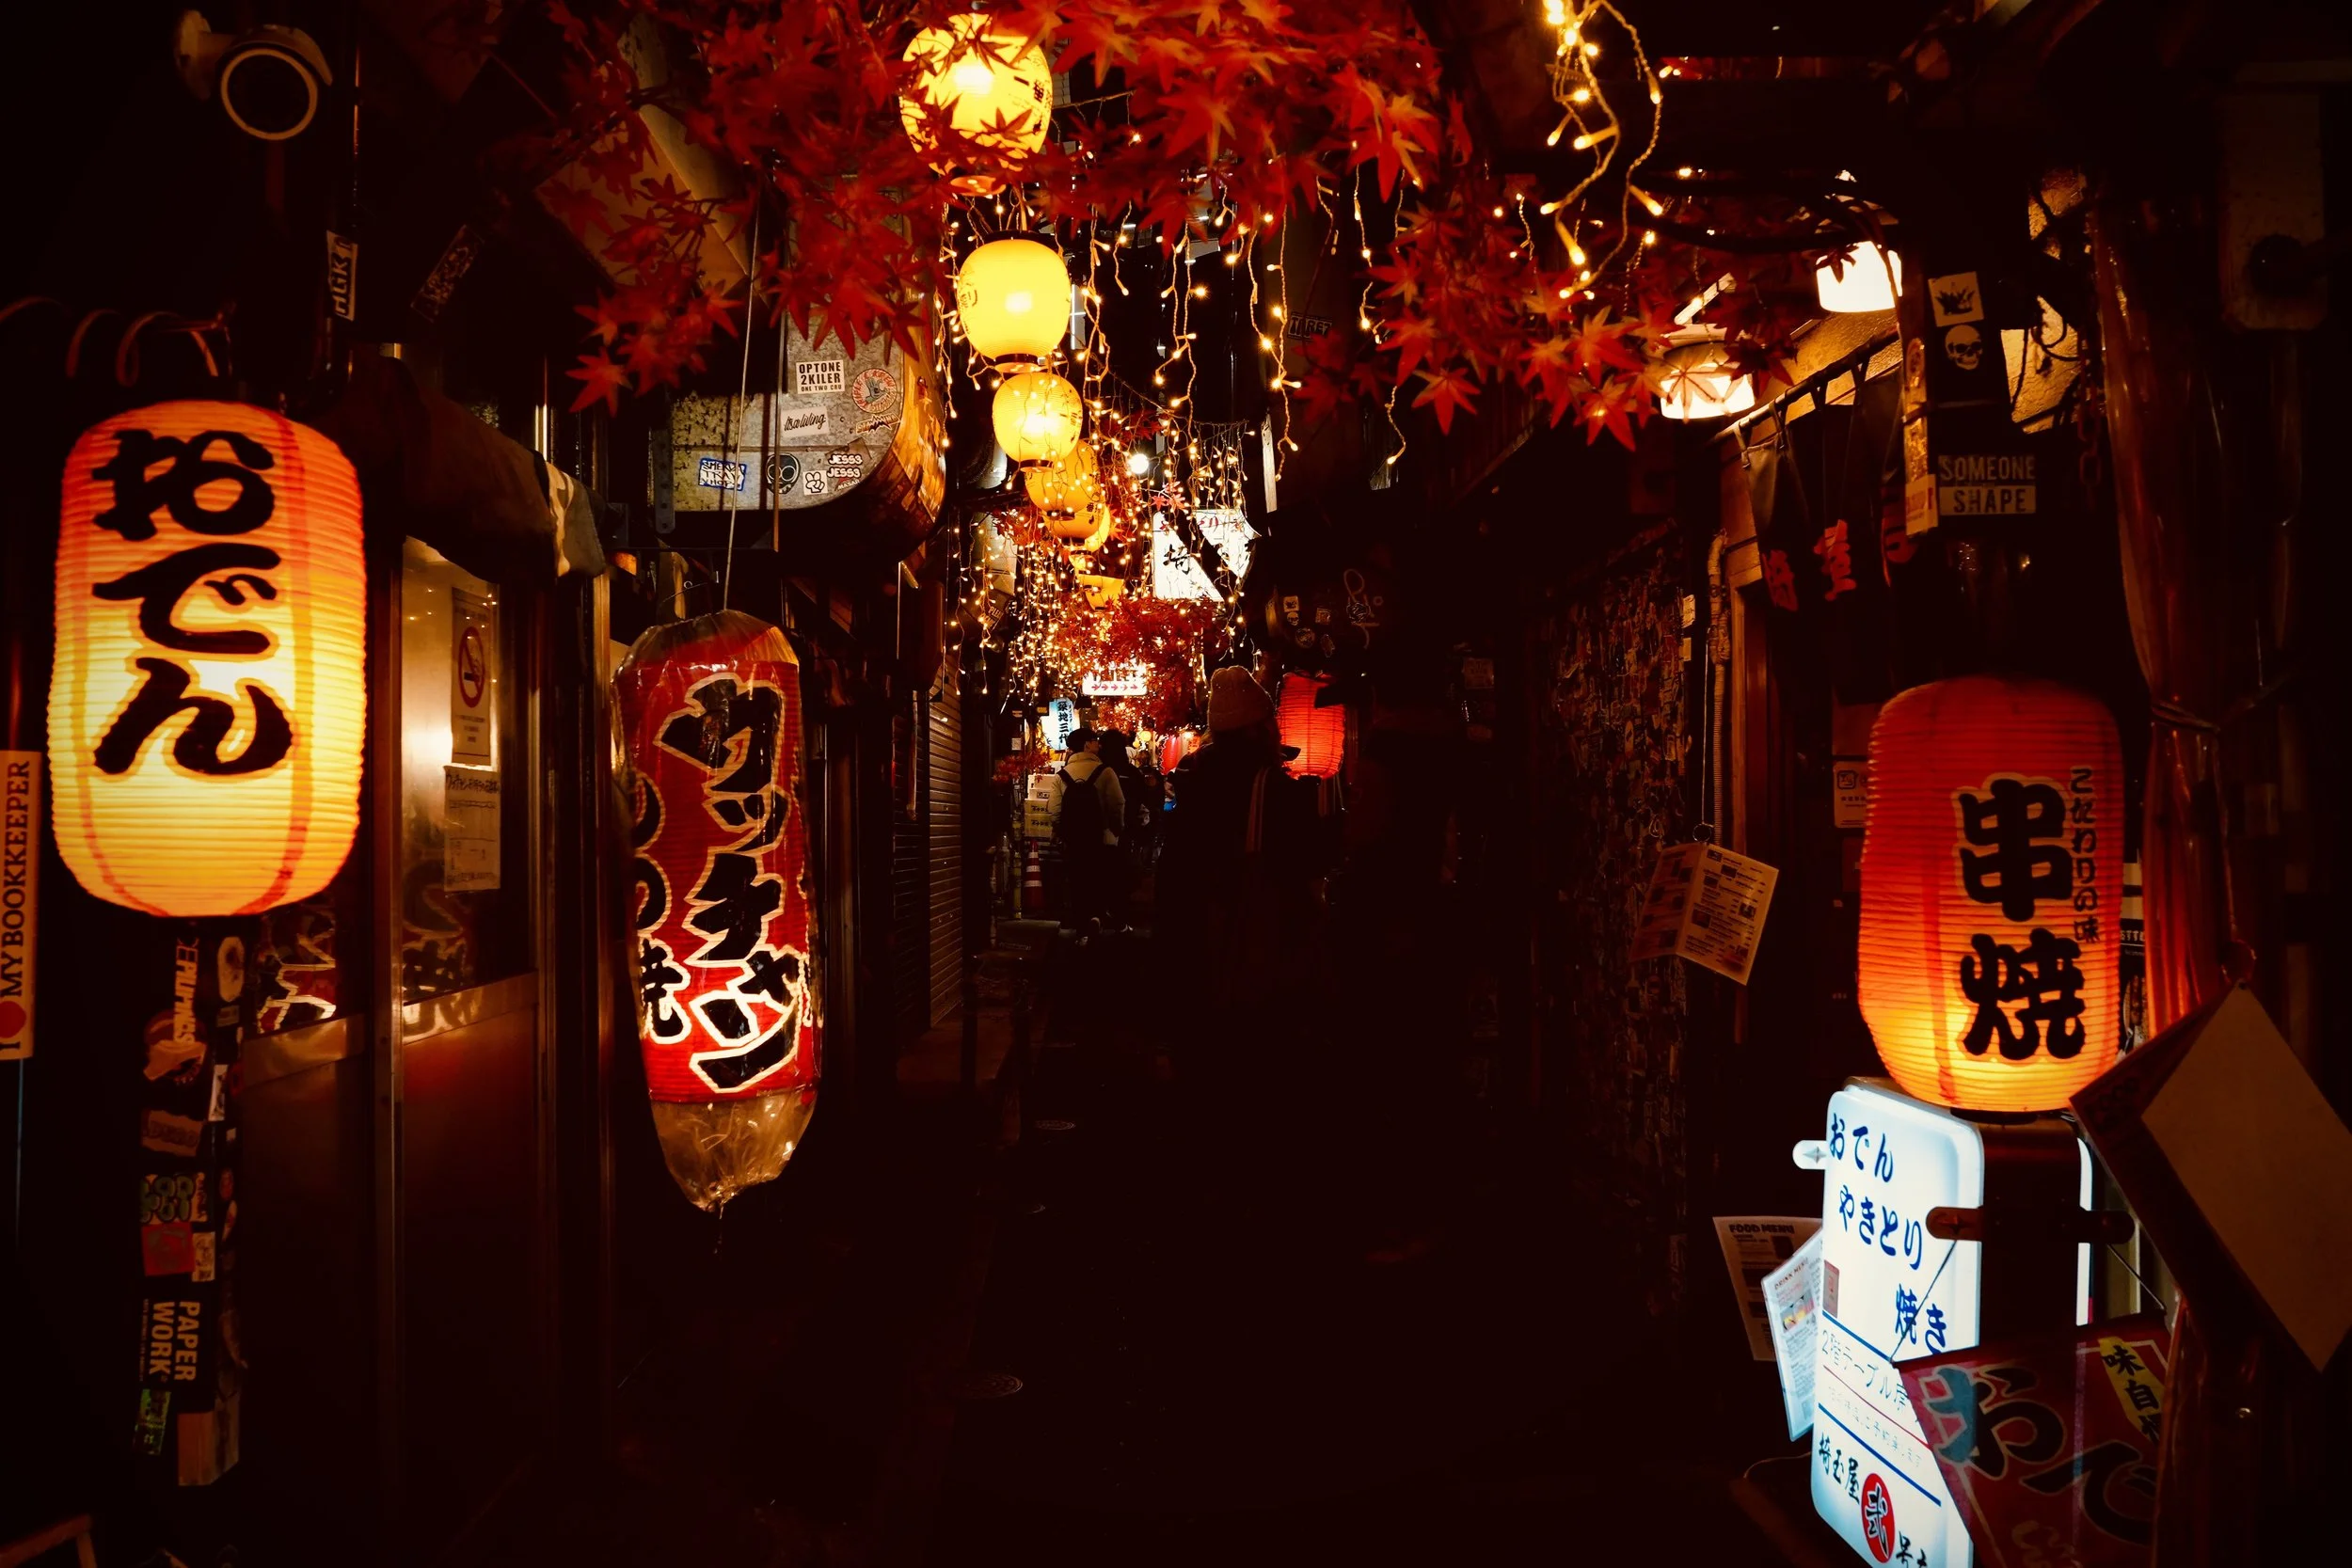
Warmth in the margins
The glow softens. Lanterns cast amber light onto wet pavement. Conversations drift into the narrow street. In neighborhoods across Tokyo, you find this balance — hyper-modern districts within walking distance of old timber storefronts; global brands beside handwritten menus.
It isn’t randomness. It’s layering.
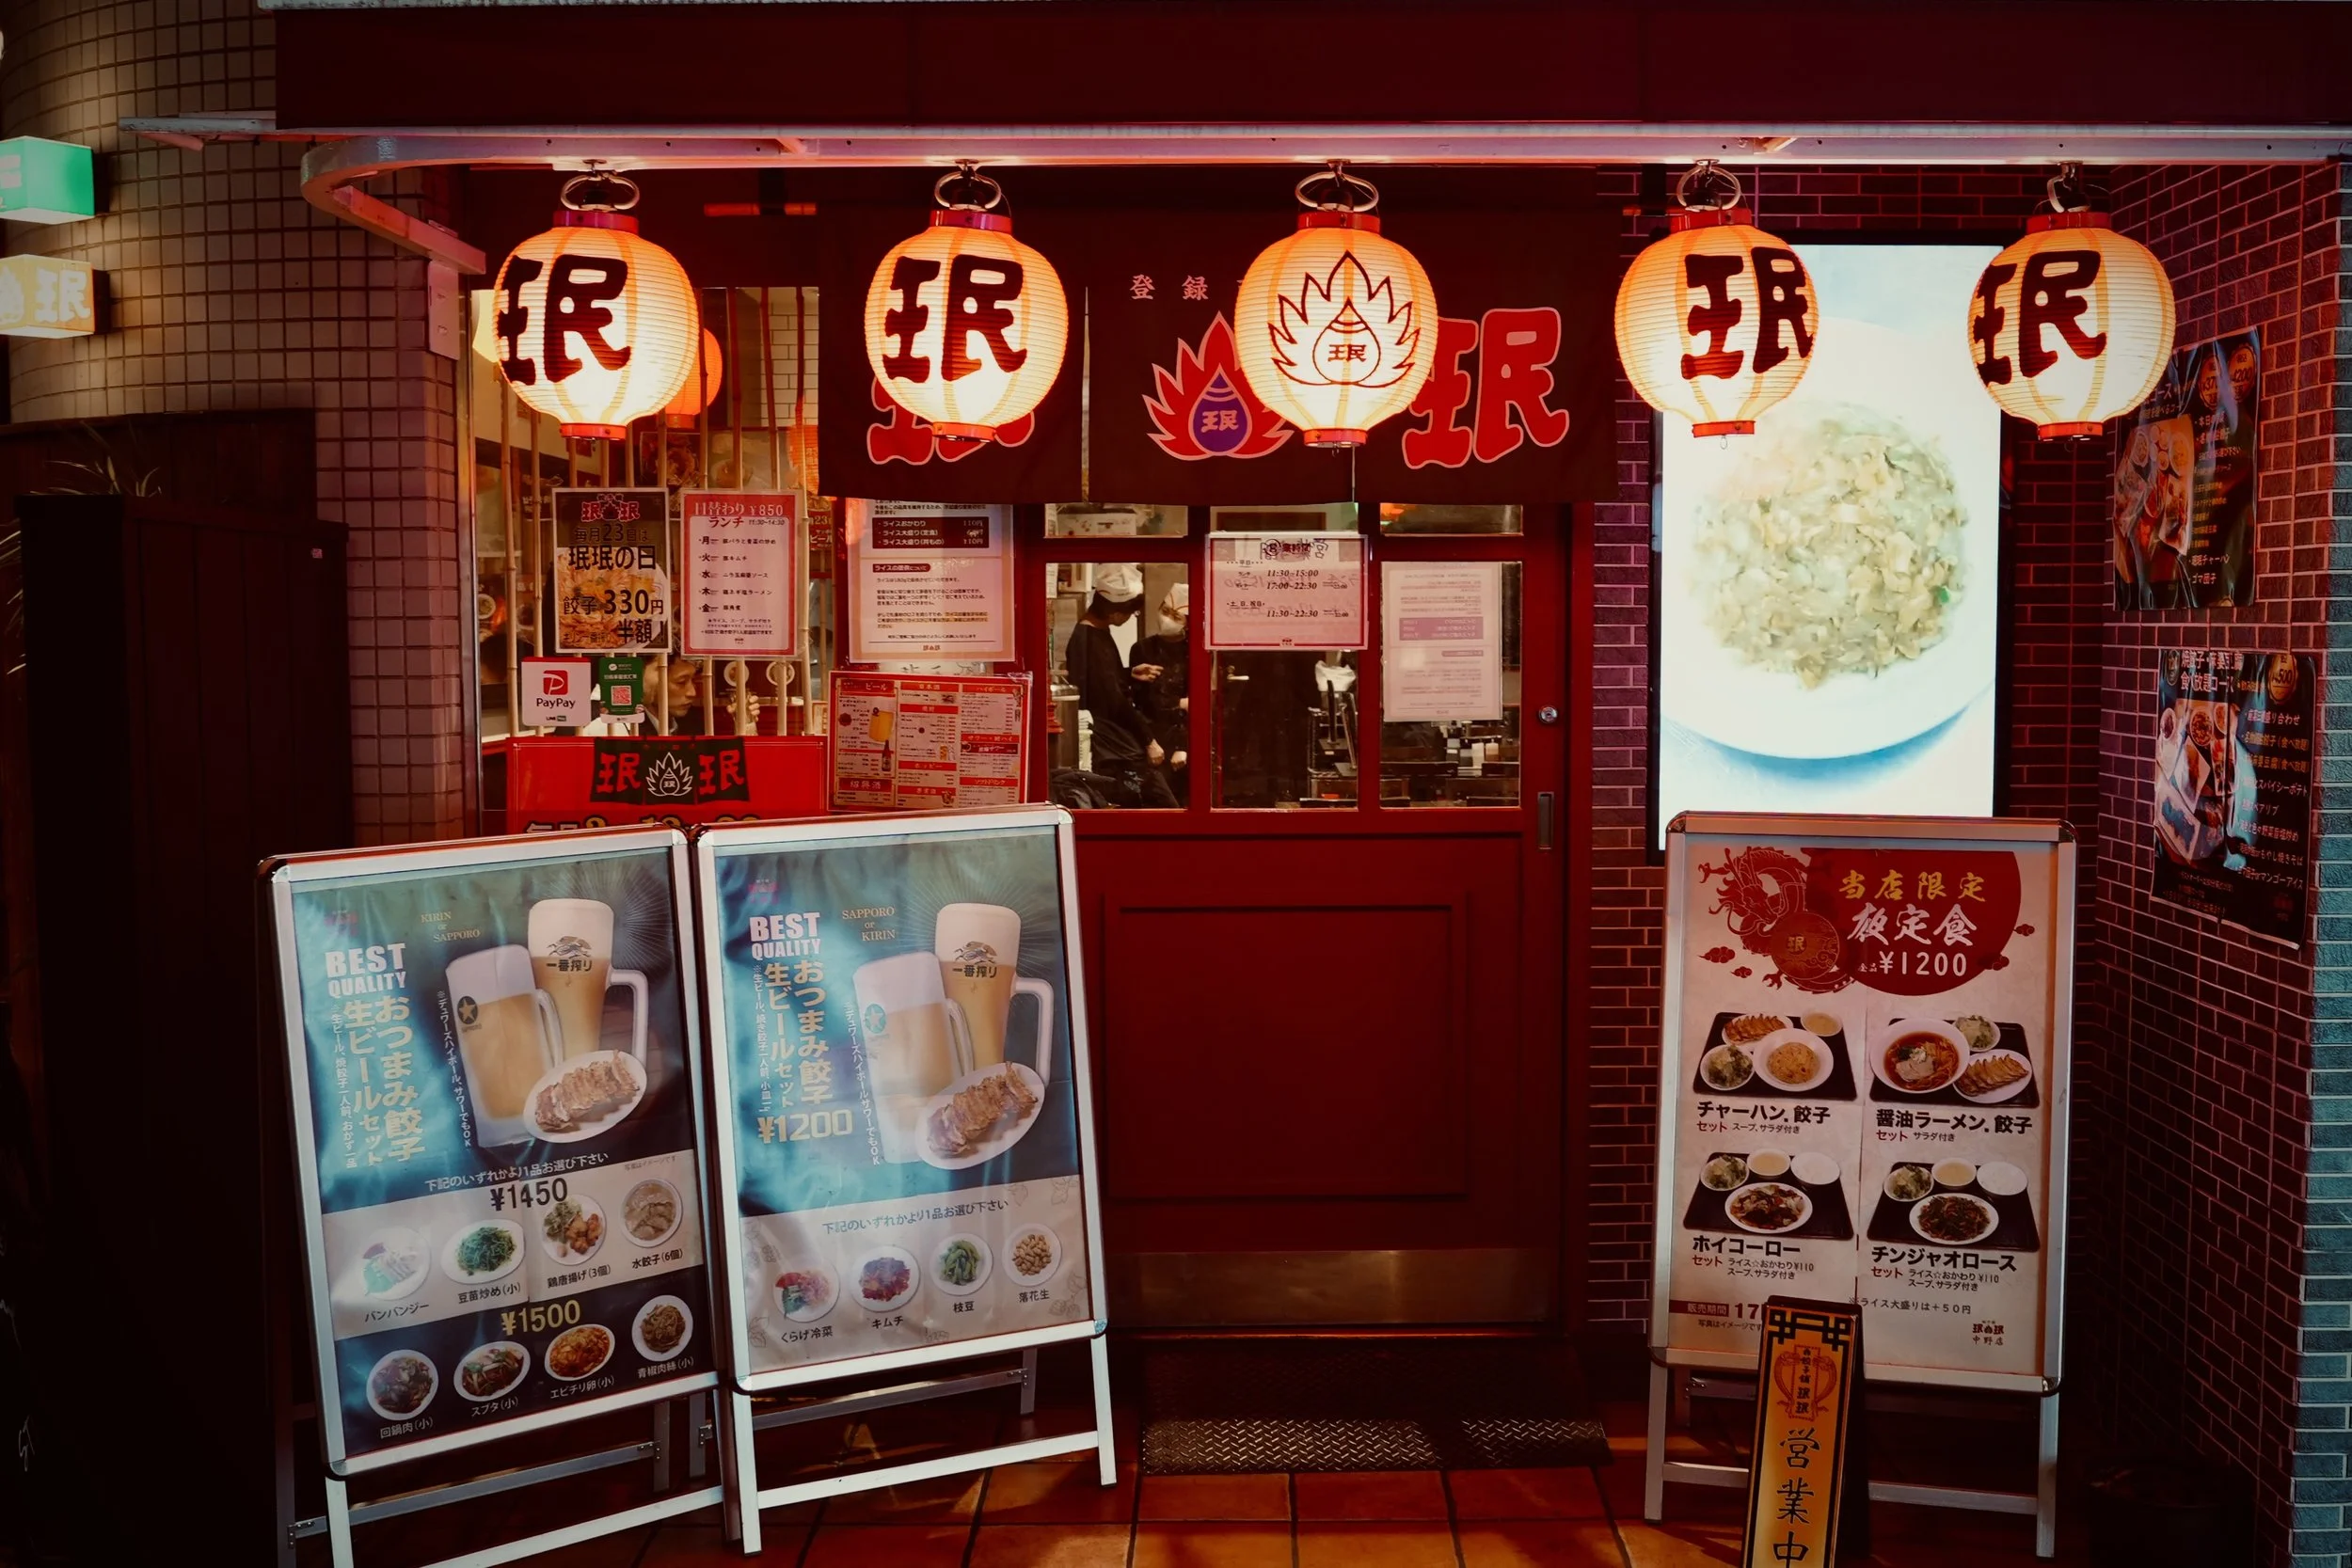
Data you can eat
Menu boards act like analog dashboards. Prices are transparent. Photos reduce uncertainty. Decision friction drops. Tokyo has more Michelin-starred restaurants than any city in the world, but it also thrives on 600-yen bowls of ramen and late-night yakitori.
Choice isn’t a luxury here. It’s baseline.
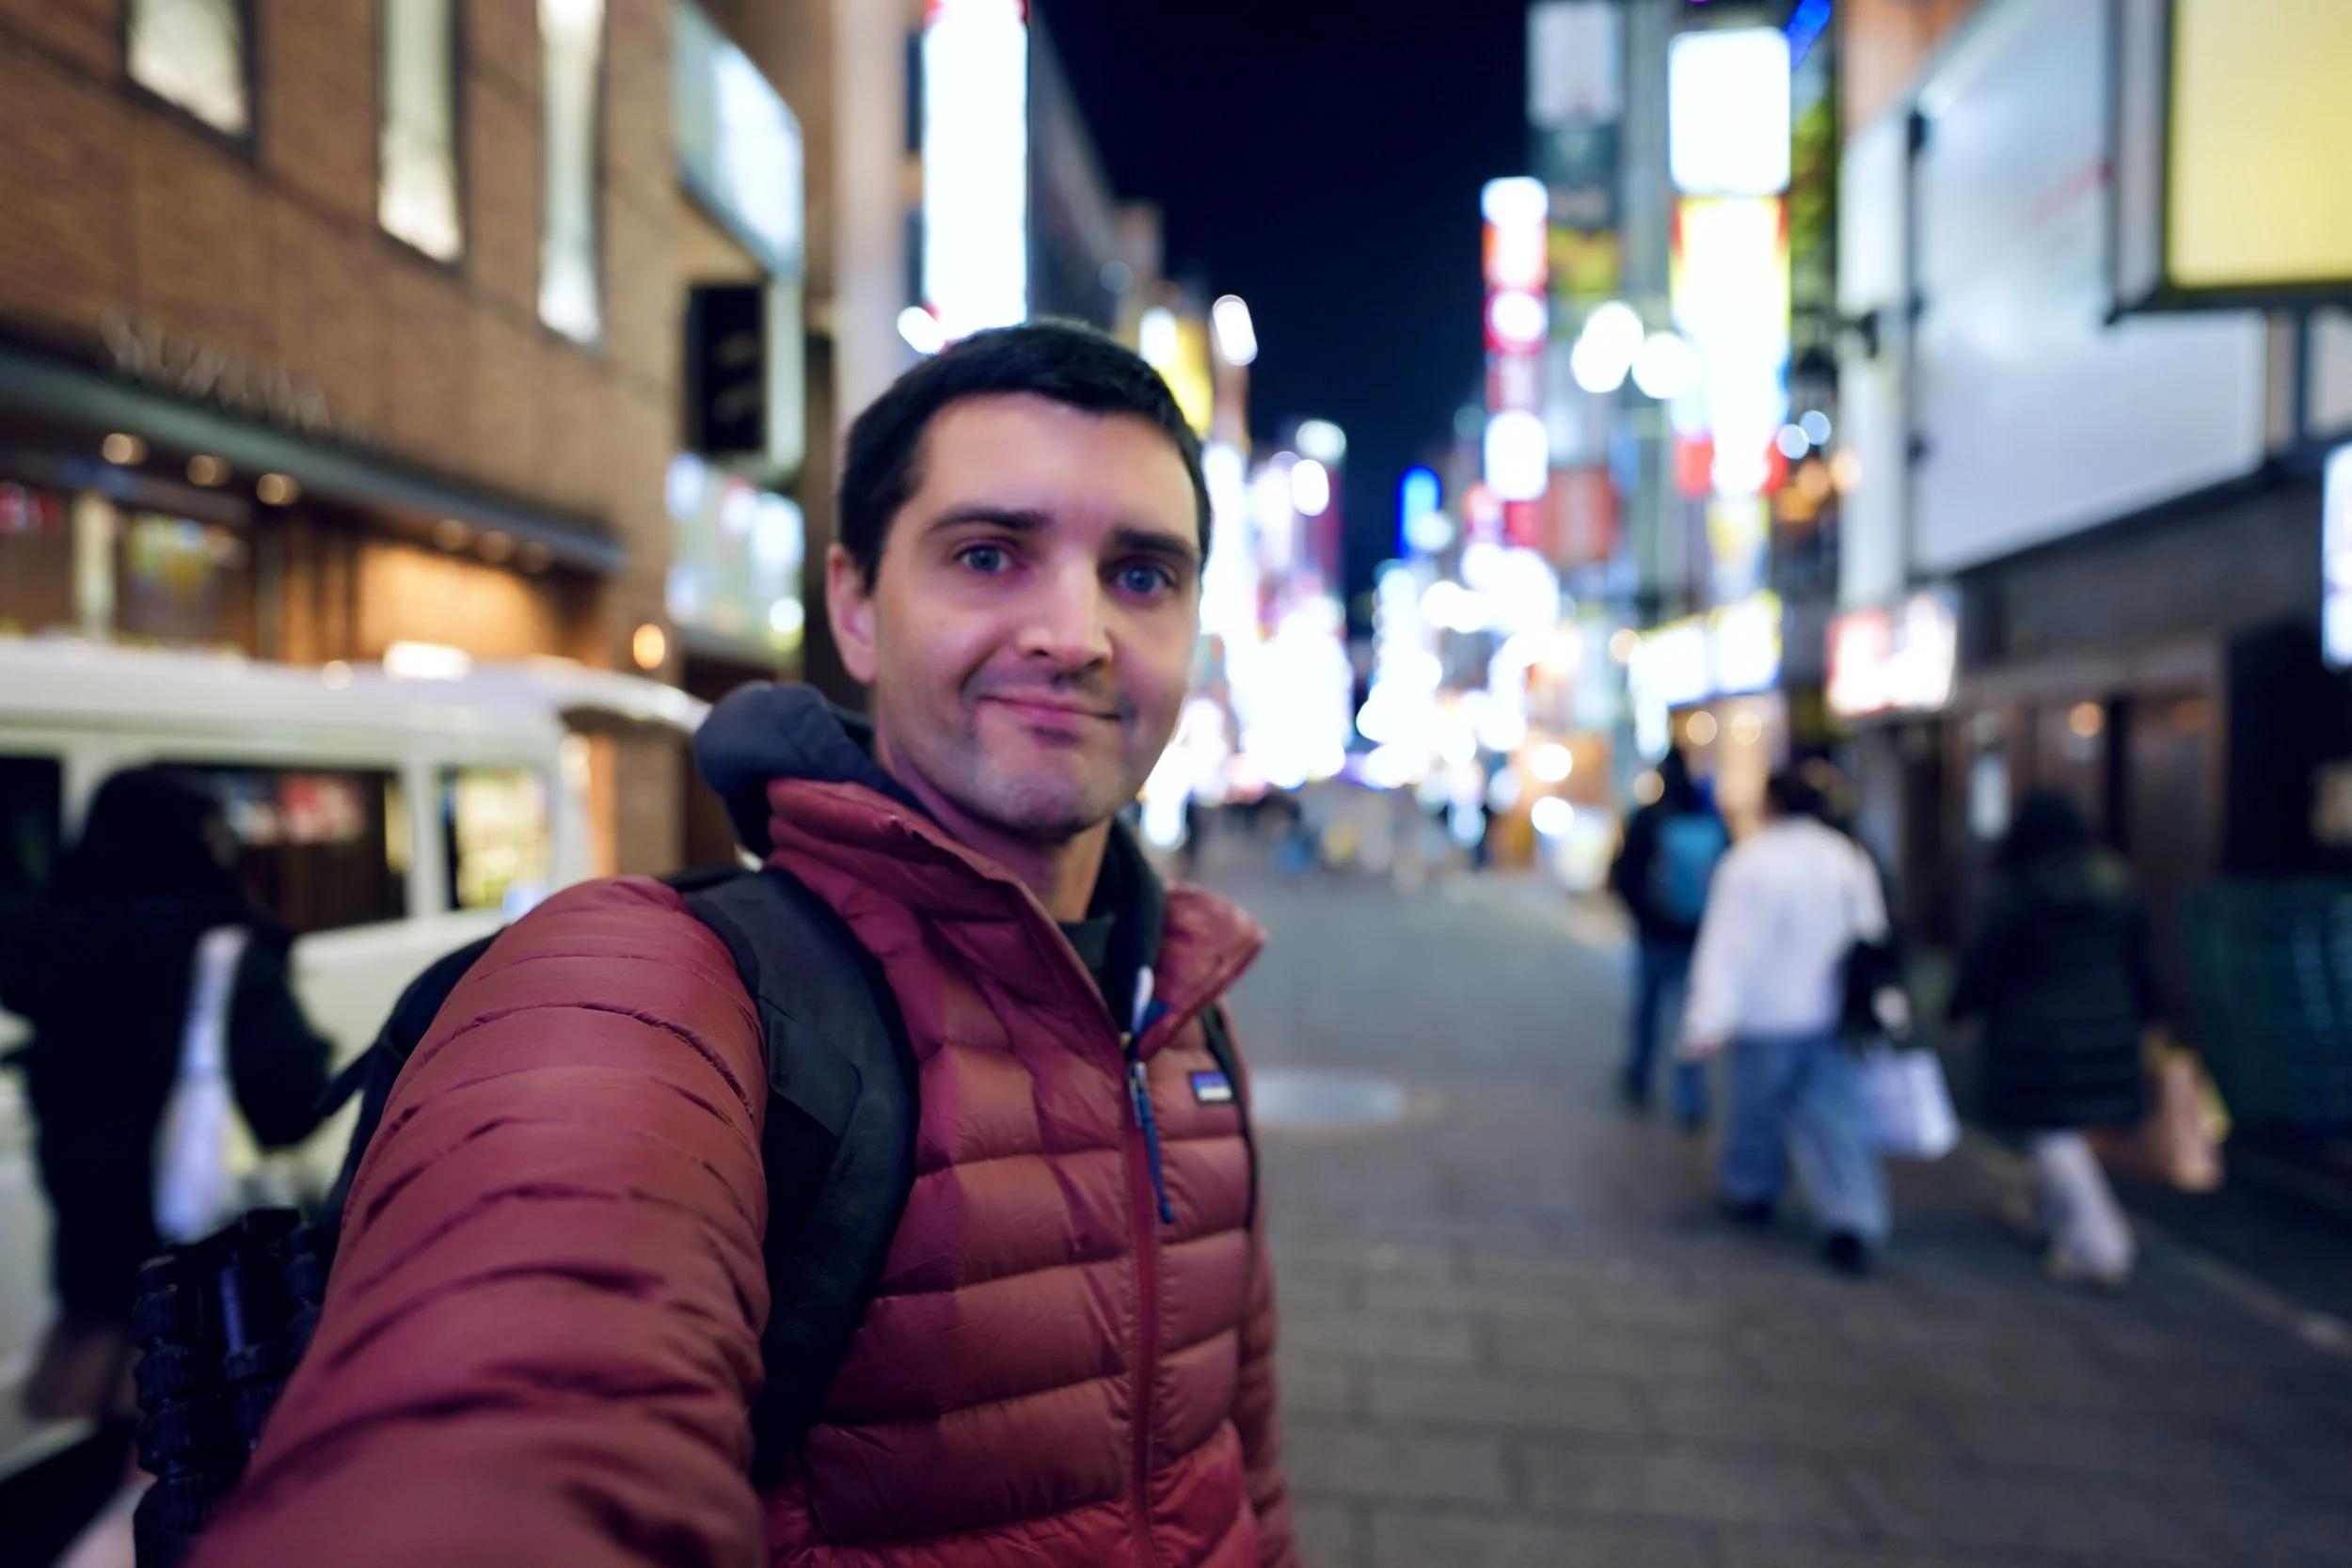
Observer inside the system
Standing in the middle of it all, camera in hand, I realize something quietly profound: cities are data, but they’re also narrative. As a data scientist, I’m trained to extract patterns. Tokyo gives you patterns everywhere — density, throughput, optimization, flow.
But it also gives you atmosphere. And atmosphere resists quantification.
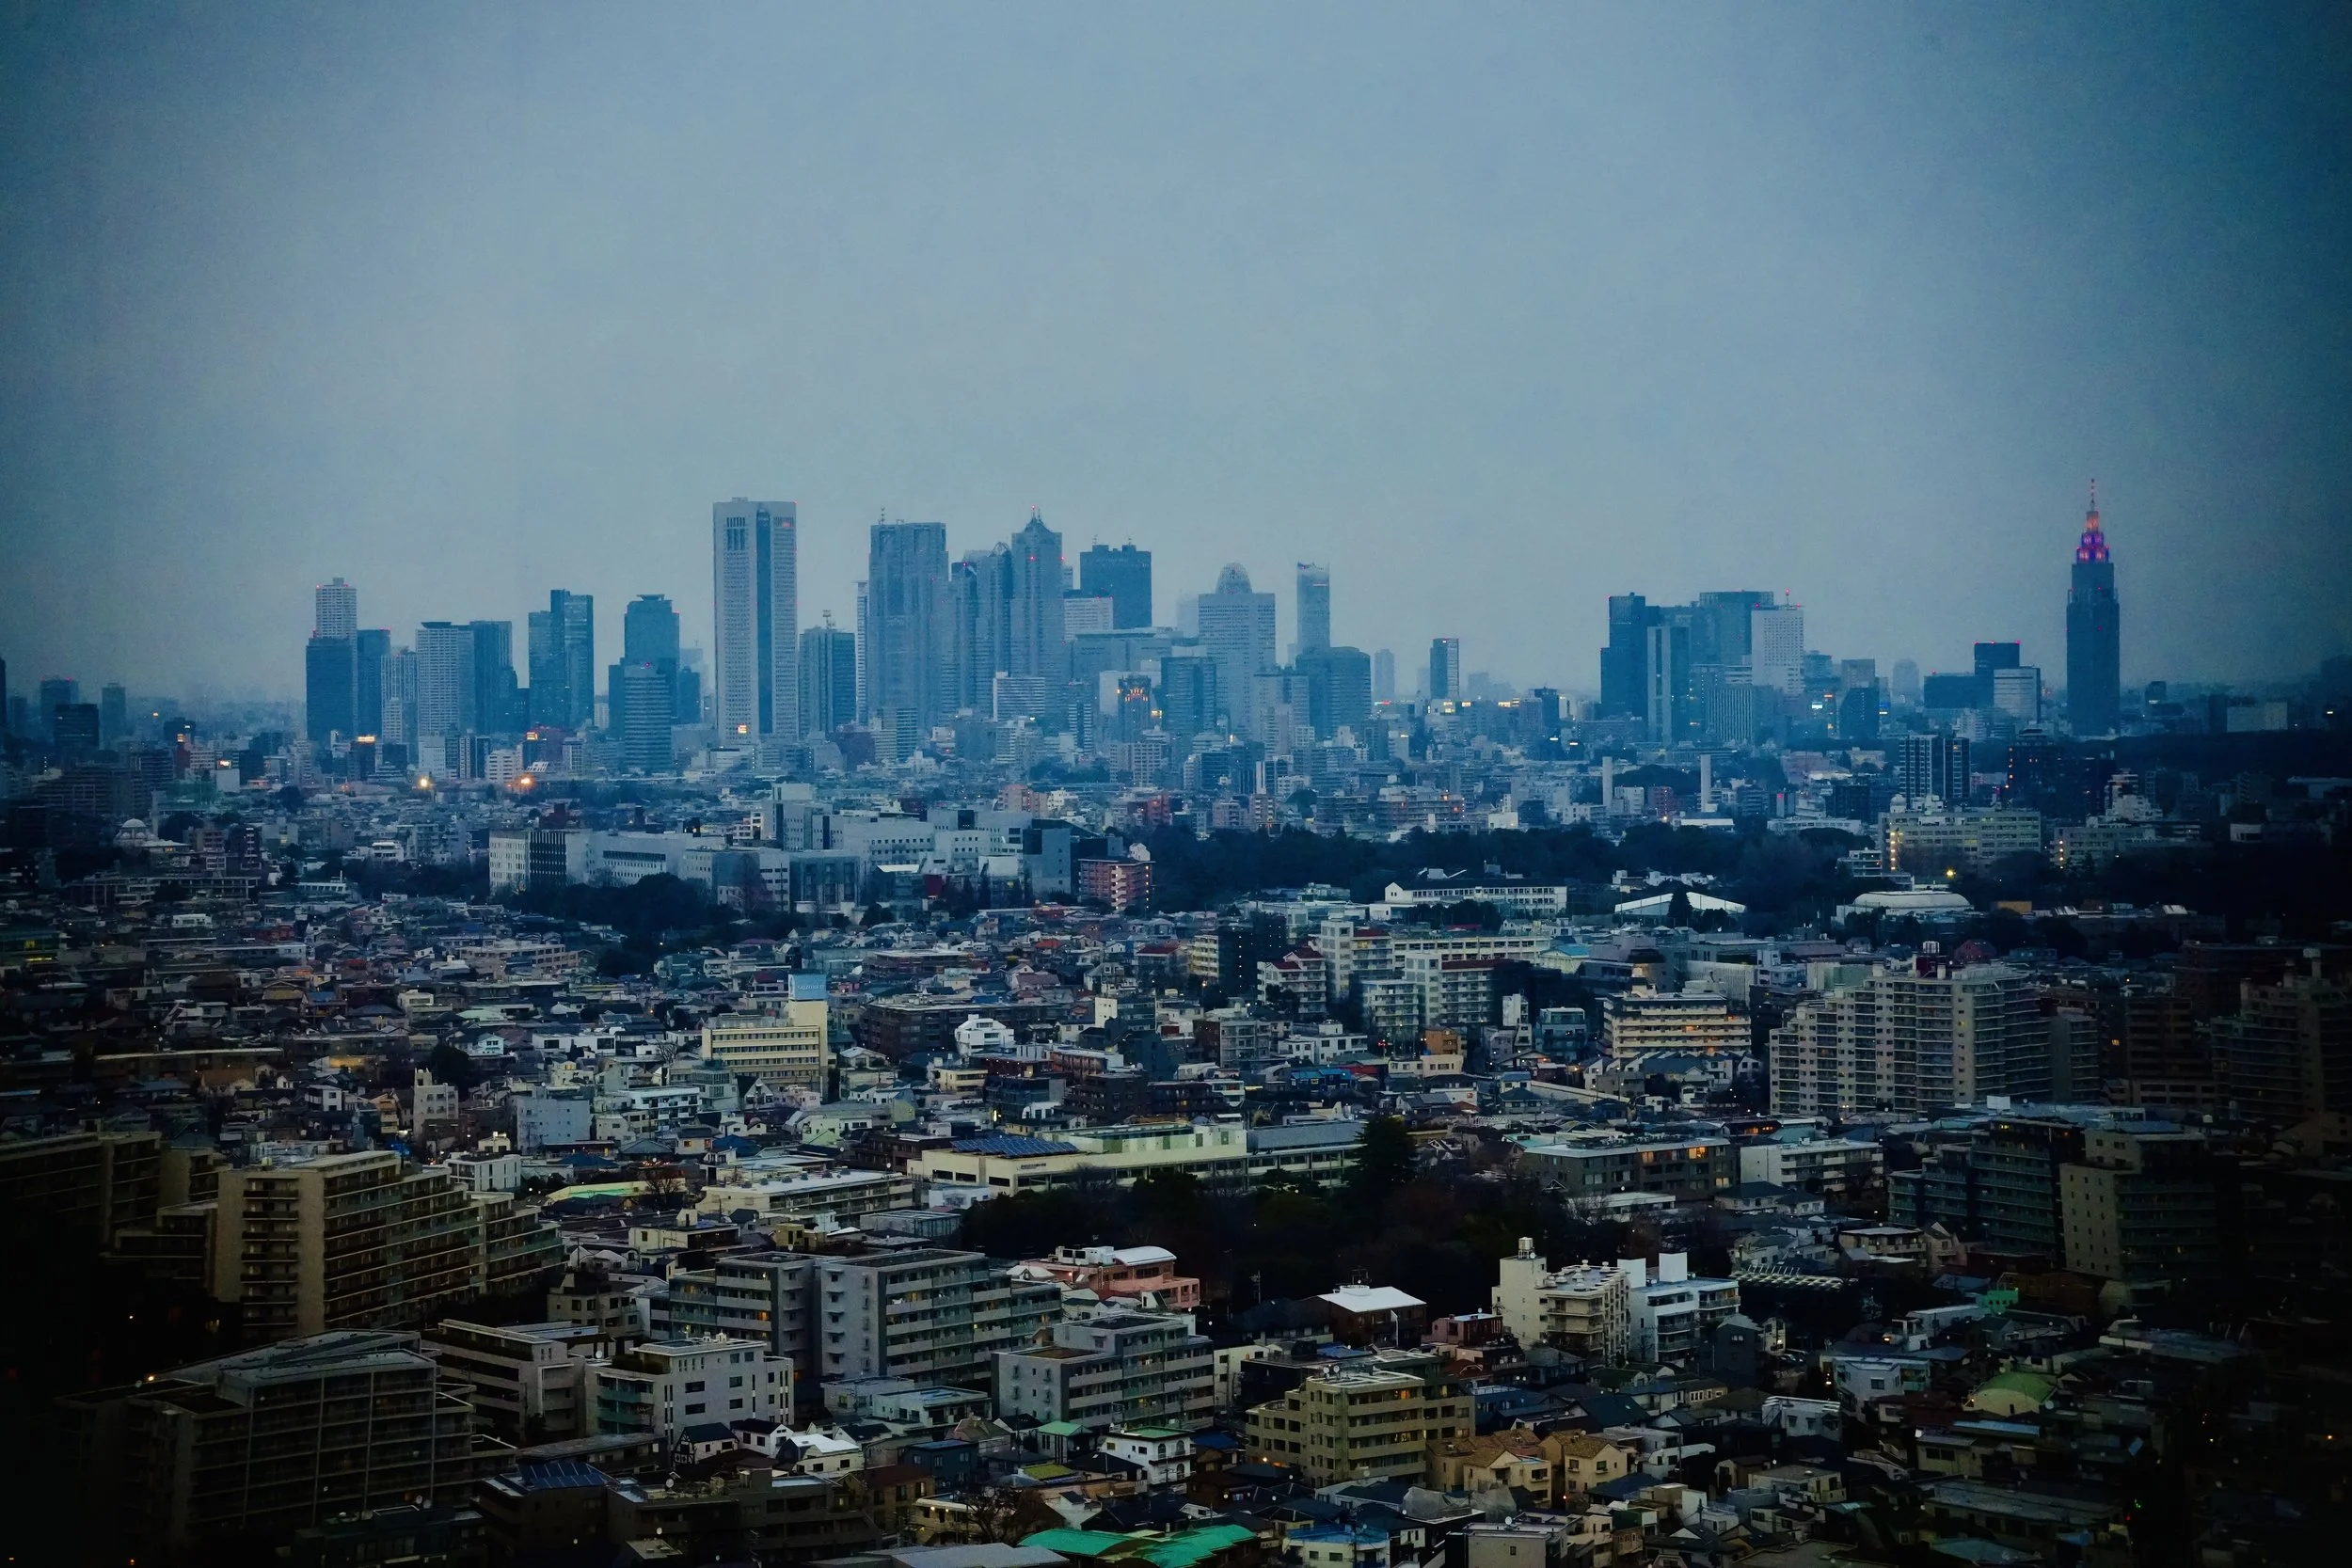
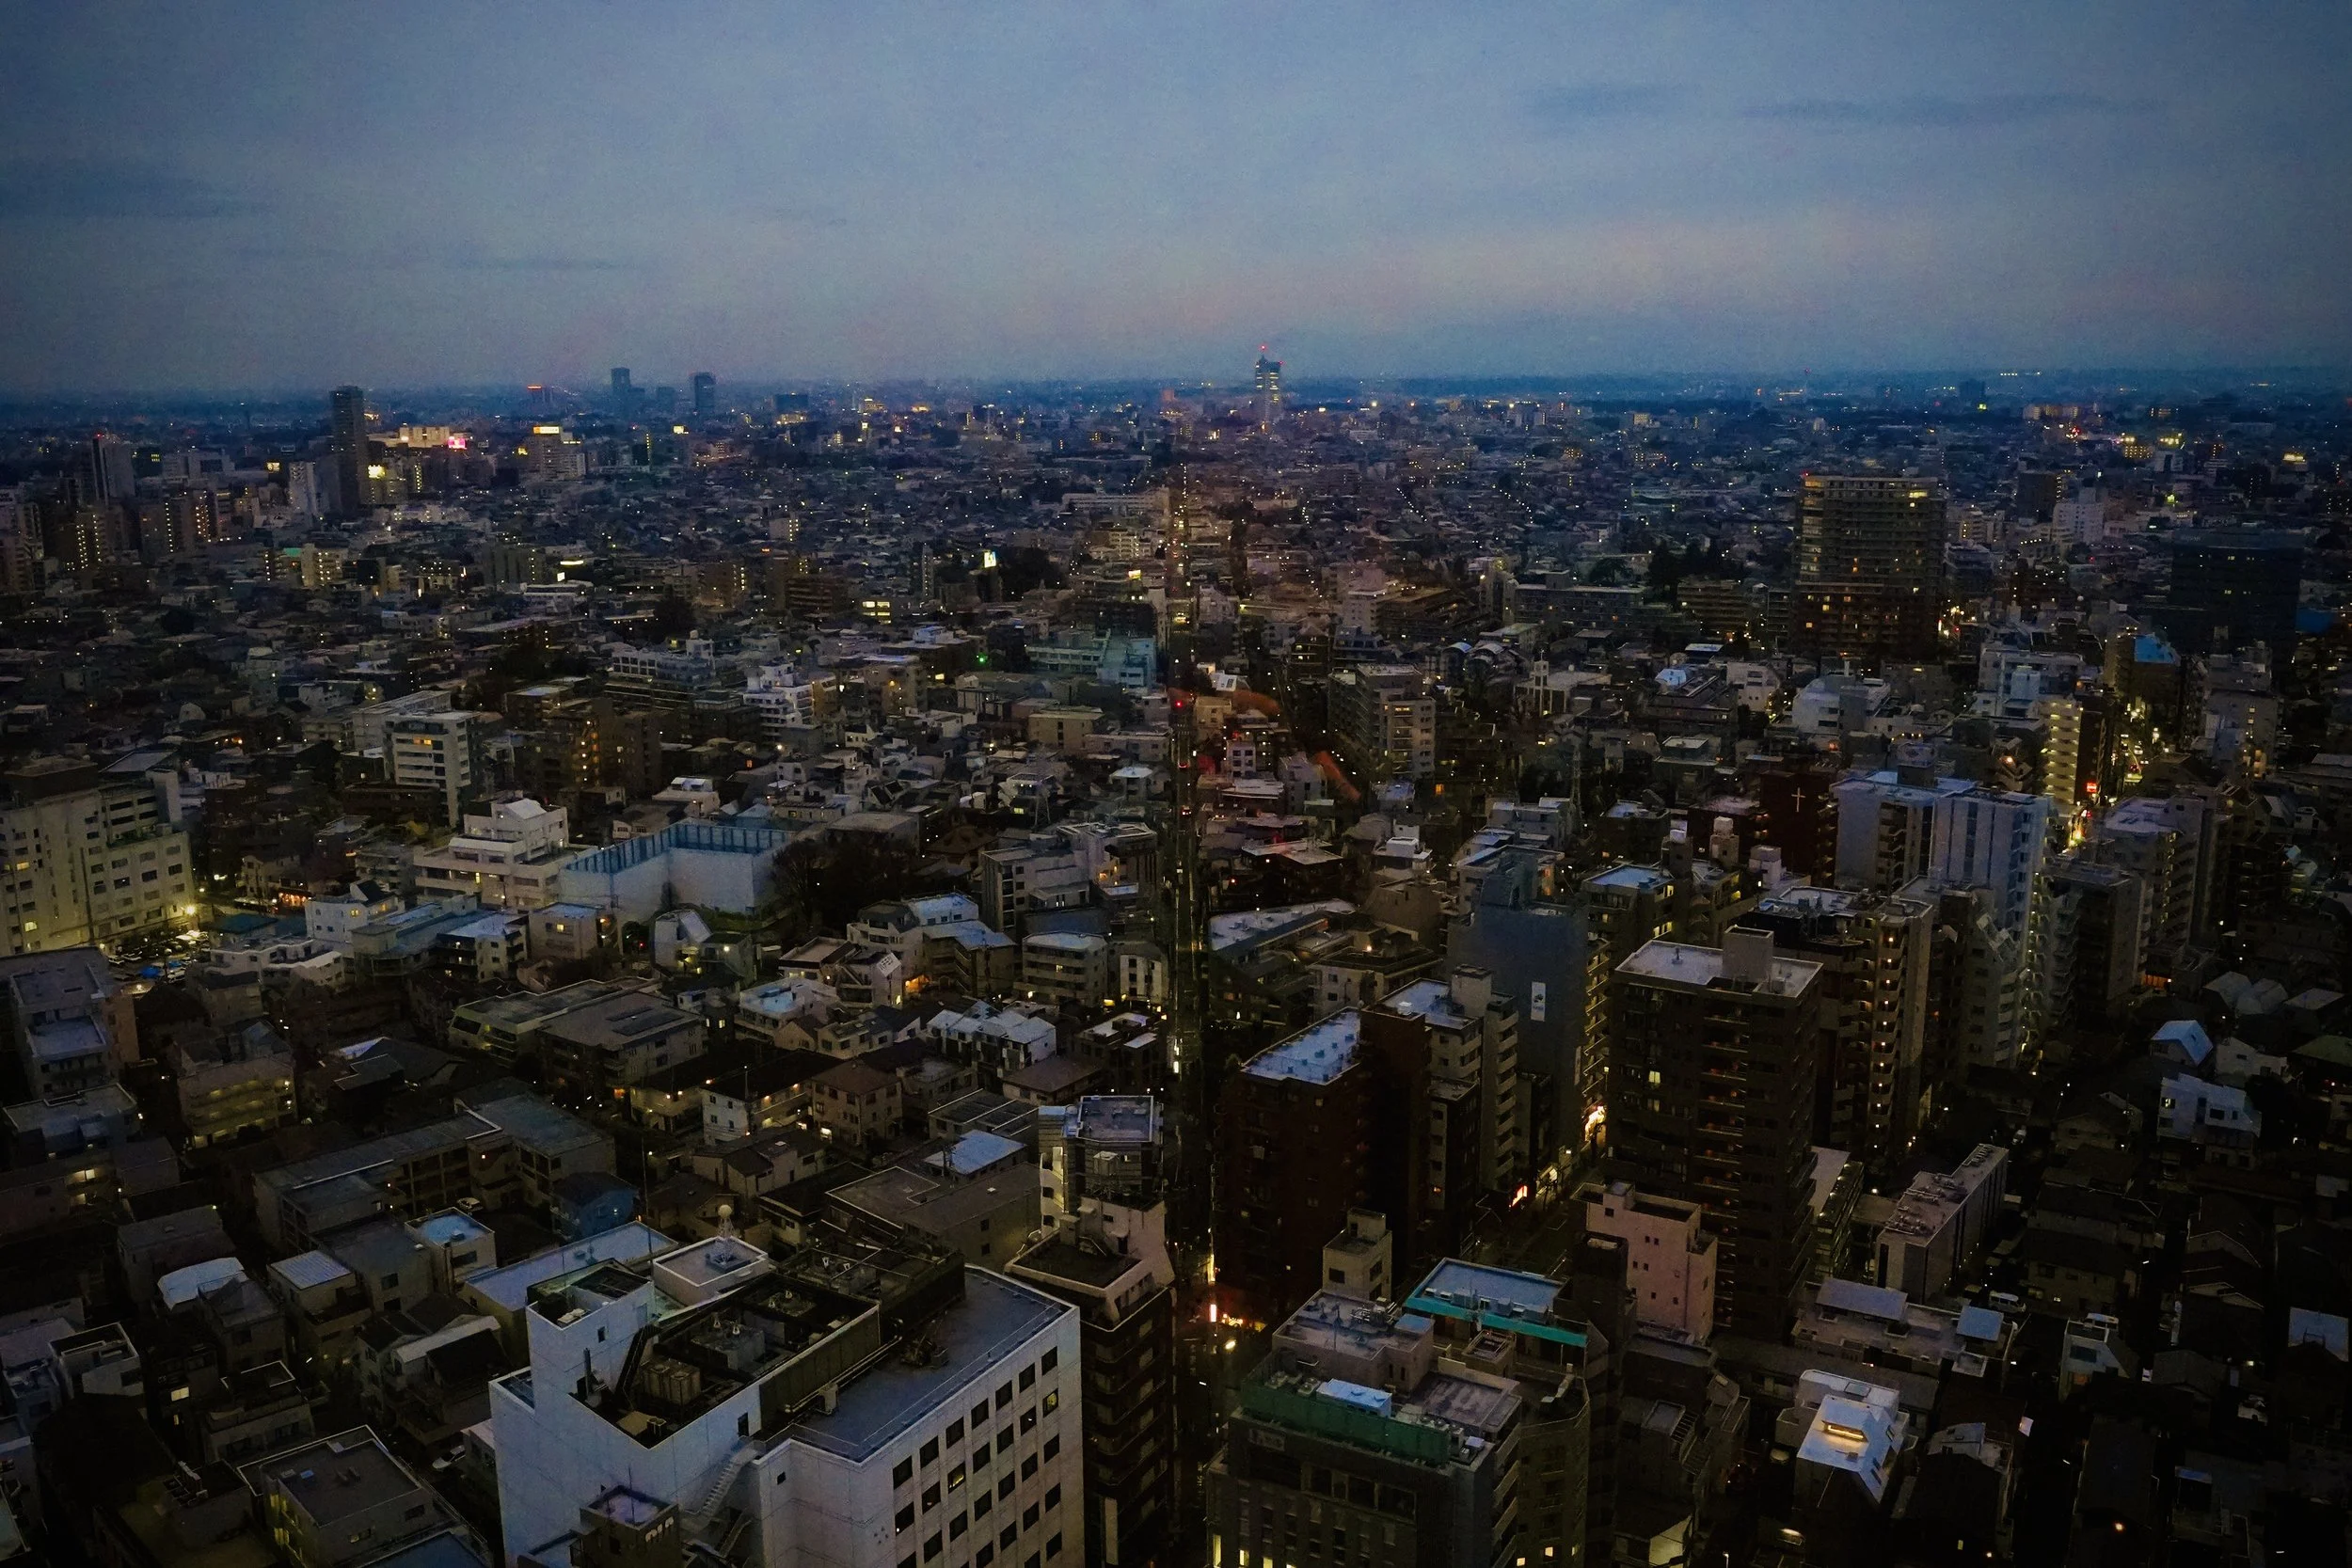
The grid extends beyond imagination
When you rise above the city, districts dissolve into a continuous grid stretching toward the horizon. Tokyo is not just skyscrapers; it is an ocean of mid-rise residential blocks, small homes, and neighborhood clusters. From above, the city resembles a plotted matrix — intersections as nodes, streets as edges.
But what looks orderly from the sky feels immersive at street level.
Scale meets atmosphere
Clusters of towers mark the business districts, while low-rise neighborhoods fill the foreground. Tokyo holds the largest metropolitan economy in the world, yet it feels surprisingly livable. Perhaps that’s the real metric: scale without suffocation.
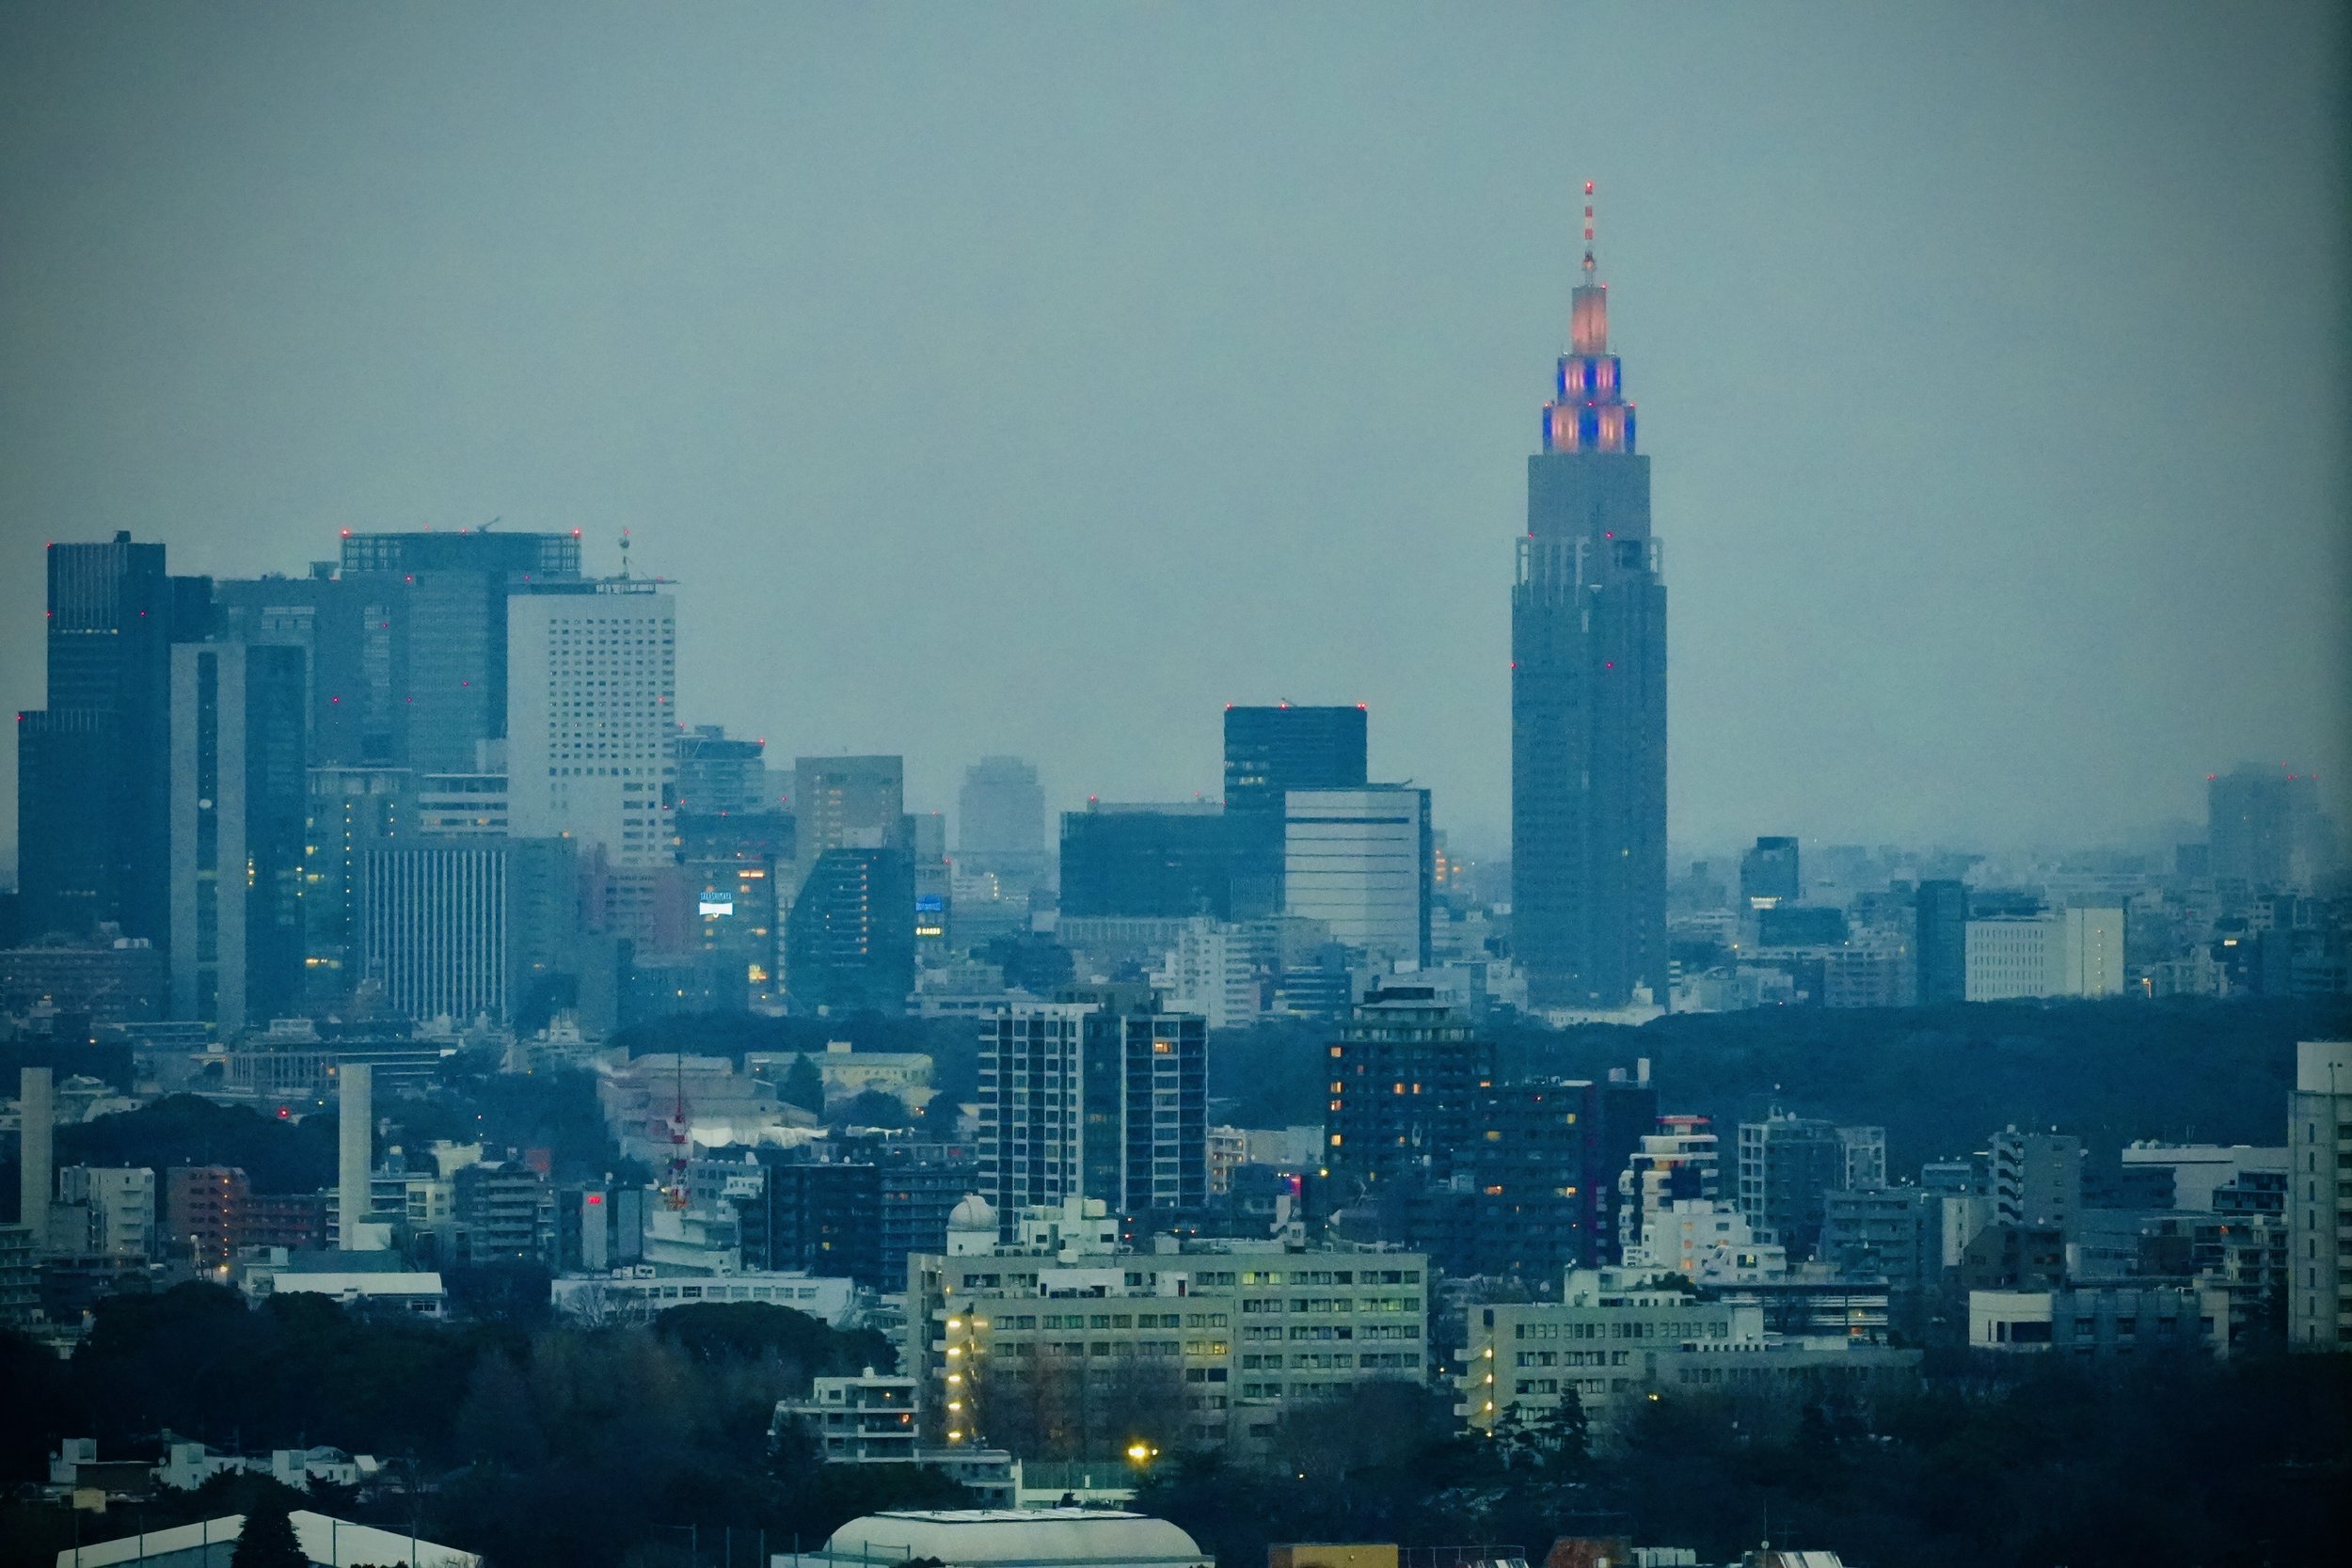
Light persists
Even from miles away, individual windows glow. Each one a variable. Each one a story. Night does not silence Tokyo. It redistributes it.
Tokyo after dark is not chaotic. It is calibrated. From Shinjuku’s vertical blaze to lantern-lit alleys tucked between train lines, the city demonstrates what happens when density is paired with infrastructure and cultural discipline.
The numbers explain its scale: population, transit throughput, restaurant density, economic output. But the experience explains its magnetism. The hum of overhead wires. The glow of paper lanterns. The skyline fading into blue haze.
Tokyo is measurable. But it is also immeasurable.
And sometimes the most interesting datasets are the ones you walk through.
To see more photos & videos from my travels visit the links below
happy traveling,
~Sean